Evaluation of the accuracy of a prognostic model for the risk of fetal macrosomia
Tysyachny O.V., Romanov A.Yu., Baev O.R., Grebenshchikova L.Yu.
The Fetal Medicine Foundation (FMF) has demonstrated that the risk of having a large baby and/or fetal macrosomia can be predicted based on screening data in the first trimester. Numerous models for predicting fetal macrosomia have been described in contemporary scientific literature. However, due to the limited effectiveness, these predictive models are not used in clinical practice. Given that fetal macrosomia is associated with a high risk of adverse obstetric and neonatal outcomes, it is important to estimate the value of the prediction model for the birth of a large fetus created by the FMF.
Objective: To explore the discriminatory ability and prognostic value of the FMF prediction model for large for gestational age fetus.
Materials and methods: We conducted a retrospective validation cohort study. It included 600 participants who were divided into two groups. The main group (n=300) consisted of women who gave birth to large for gestational age babies (baby’s weight equal to or over the 90th percentile). The comparison group (n=300) included women who gave birth to babies weighing between the 10th and the 90th percentiles. Large for gestational age was defined when birth weight was equal to the 90th percentile for their gestational age.
Results: We identified the differences in the values of weight, height and the PAPP-A levels (MoM) in the examined women (p<0.0001 and p=0.02), that were higher in group I (fetal macrosomia). ROC analysis showed a moderate ability of the model to distinguish between the patients with a high and low risk of developing macrosomia: AUC of 0.66, sensitivity – 59.68%, specificity – 56.82%, positive predictive value – 49.33%, negative predictive value – 66.67%, and accuracy – 58%.
Conclusion: Our study explored the discriminatory ability of the FMF model and its predictive value for having large for gestational age babies in the population of the Russian women. Analysis of the calibration curve showed that the model is characterized by satisfactory preservation of relative risks, but requires baseline risk adjustment. We believe that the differences in prediction accuracy are due to application of this model in different populations.
Authors' contributions: Tysyachny O.V. – study concept and design, data collection and analysis; Romanov A.Yu. – statistical analysis; Baev O.R. – manuscript editing; Grebenshchikova L.Yu – manuscript writing.
Conflicts of interest: The authors declare that they have no conflicts of interest.
Funding: The study was carried out without any sponsorship.
Ethical Approval: The study was approved by the local Ethics Committee of V.I. Kulakov National Medical Research Center
for Obstetrics, Gynecology and Perinatology, Ministry of Health of Russia.
Patient Consent for Publication: The patients have signed informed consent for participation in the study and publication of their data.
Authors' Data Sharing Statement: The data supporting the findings of this study are available on request from the corresponding author after approval from the principal investigator.
For citation: Tysyachny O.V., Romanov A.Yu., Baev O.R., Grebenshchikova L.Yu.
Evaluation of the accuracy of a prognostic model for the risk of fetal macrosomia.
Akusherstvo i Ginekologiya/Obstetrics and Gynecology. 2026; (3): 68-74 (in Russian)
https://dx.doi.org/10.18565/aig.2025.309
Keywords
large fetus for gestational age
fetal macrosomia
large fetus
In the modern obstetric care paradigm, pregnancy and birth outcomes are often predicted using combined models that take into account the clinical and anamnestic data of pregnant women and different biomarkers. Professional societies recommend application of prediction models that use Bayes' theorem. For example, a model for determining the risk of preeclampsia and fetal growth restriction at 11–13 weeks of pregnancy was created based on this theorem [1].
The Fetal Medicine Foundation (FMF) has recently demonstrated that the risk of a large-for-gestational-age fetus, or fetal macrosomia can also be predicted based on the first trimester screening data [2].
Many models for predicting fetal macrosomia have been described in the contemporary scientific literature, that use a combination of clinical, biochemical and biophysical variables [3–6]. However, due to the limited prognostic effectiveness, they are not used in clinical practice.
Creation of the FMF model is based on the study by Leona C.Y. et al. They showed that, fetal macrosomia can be predicted combining maternal characteristics and the first trimester screening data, and 34% of women who could give birth to large babies were identified, with a false-positive rate of 10% [7]. However, there is no data in the contemporary scientific literature confirming the effectiveness of this model in clinical practice.
Given that fetal macrosomia is associated with a high risk of adverse obstetric and neonatal outcomes [8], it is crucial to determine the significance of this model for predicting the birth of a large baby.
The aim of the study was to explore the discriminatory ability and prognostic value of the prediction model for having a large for gestational age baby, that was created by the FMF.
Materials and methods
We conducted a retrospective validation cohort study based on the first trimester screening data and pregnancy outcomes. The study included 600 participants. The data on the course of pregnancy, delivery and neonatal period were obtained from electronic patient records.
Inclusion criteria in the study were white women in population of the Russian women aged 18–40 years, primiparity, spontaneous singleton pregnancy, cephalic fetal presentation, gestational age at birth ≥37 weeks, and the established diagnosis of gestational diabetes mellitus. From January to December 2024, the cohort of examined patients included women who underwent the combined first trimester screening at 11–14 weeks of pregnancy at V.I. Kulakov National Medical Research Center for Obstetrics, Gynecology and Perinatology.
Non-inclusion criteria were severe somatic symptoms, chromosomal abnormalities and fetal malformations, pregnancy complications (preeclampsia, gestational hypertension), as well as termination of pregnancy, miscarriage or birth before the 36th week of pregnancy.
Two groups were formed. The main group (n=300) included women who gave birth to large for gestational age babies (birth weight ≥ the 90th percentile). The comparison group (n=300) comprised women who gave birth to babies who had birth weight from the 10th to the 90th percentile. Babies born at the 90th percentile for weight were defined as large for gestational age (LGA) [9]. Birth weight in percentiles was assessed using INTERGROWTH-21st calculator available at https://intergrowth21.ndog.ox.ac.uk/en/ManualEntry/Compute
Statistical analysis
G*Power software version 3.1.9.7 was used to assess the statistical reliability of the retrospective sample for validation of the predictive model [10]. The primary goal of validation was to assess the discriminatory power of the model, and z-test was used to compare two independent proportions. Post-hoc power analysis was performed, since the sample size was predetermined by the collected data. The samples size was 600 participants. Among them 300 women had good pregnancy outcomes (large for gestational age babies were born in the main group) and 300 women in the comparison group had poor pregnancy outcomes. The samples size was calculated using two-tailed test with α=0.05. In power analysis for statistically significant AUC difference of 0.7, the observed effect size was 0.81.
The individual risk for LGA was assessed using the FMF calculator for the risk of fetal macrosomia available at https://www.fetalmedicine.org/research/assess/macrosomia
The specialists of the Center, who performed the first trimester screening had no access to the clinical data of patients. The researchers, who evaluated the obtained screening results also had no access to the clinical data of patients and reference ranges for the screening test.
The following maternal factors which uses the FMF model were taken into account in risk calculation: weight and height of pregnant women, smoking status, a history of chronic hypertension and diabetes mellitus. The following fetal factors were then analyzed: crown-rump length (mm), nuchal translucency (NT) (mm), the levels of β-hCG (MoM) and PAPP-A (MoM). All necessary tests were performed within the given timeframe and under conditions specified in the clinical guidelines for “Normal Pregnancy”, that ensured the timeliness and completeness of the study [11].
Given that the FMF guidelines do not provide information about the risk threshold at which the risk of fetal macrosomia should be considered high, in our study a threshold on a scale from 1 to 100 was chosen for fetal macrosomia. Therefore, the values > 100 were considered as low risk, while the values ≤ 100 were considered as high risk. This threshold was chosen by us based on the previous FMF guidelines, and due to the fact that it is used as a standardized value in medical facilities. Thus, it is known that placental insufficiency plays an important role in the etiology of preeclampsia and fetal growth restriction. Contemporary data indicate that fetal macrosomia also depends on the function of the placenta. Therefore, we used this threshold taking into account the concept of placental origin of this complication.
In this study we assessed the discriminatory ability and prognostic significance of the prediction model for fetal macrosomia.
All data were stored in Microsoft Excel 2016. IBM SPSS Statistics 27 for Windows was used for statistical data processing. The Shapiro–Wilk test was used to test the normality of distribution. The quantitative variables with normal distribution were described as arithmetic mean (M) and standard deviation (SD) with 95 % confidence interval (95% CI). In the absence of normal distribution, the quantitative data were descried as median (Me) and the lower and upper quartiles (Q1; Q3). ROC (receiver operating characteristic) curve was used to assess the accuracy of the prediction model. The area under the ROC curve (AUC) was used to assess the classification ability of the risk scale. The differences were considered statistically significant at p<0.05 (95% CI). Based on screening results for fetal macrosomia and the FMF algorithm, the threshold for the optimal sensitivity and specificity was determined by analyzing AUC ROC curve. The optimal cutoff value was used to calculate the diagnostic accuracy (sensitivity), the false positive rate (specificity), and the positive and negative predictive values of the FMF screening test with 95% CI.
The explored model has been developed for female population in Great Britain. However, we tested it using the indicators in population of the Russian women. Given the above, the model was calibrated. Logistic regression was used to estimate predicted probabilities in logit model, that was consistent with the current methodological recommendations [12], where outcome prediction served as a dependent variable and predicted probability served as an independent variable. For calibration curve construction, the predicted probabilities were aggregated into five bins. The mean predicted probability and the observed outcome frequency were calculated for each bin. The calibration slope (the slope) and calibration intercept (the intercept) were calculated. The calibration plot was constructed via binning of predicted probabilities and comparison between the mean predicted probability and the observed outcome frequency. The results are presented in accordance with the STARD recommendations [13].
The study was approved by the local Ethics Committee of V.I. Kulakov National Medical Research Center for Obstetrics, Gynecology and Perinatology, Ministry of Health of Russia. All women have signed informed consent to participate in the study.
Results
Characteristics of pregnant women, as well as the first trimester screening data in the studied groups are represented in Table 1.
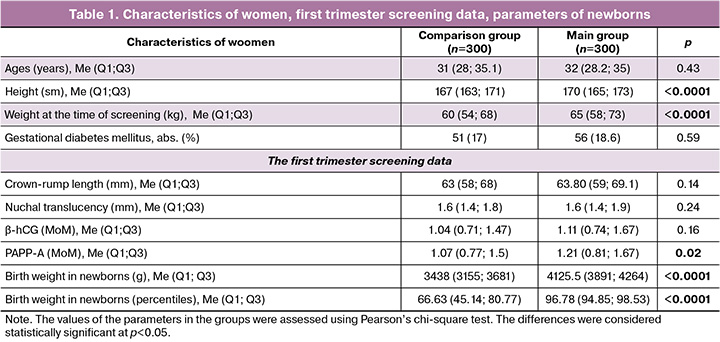
The women included in the study were of similar age. Assessment of weight and height showed that these parameters were higher in pregnant women in the main group: 170 cm versus 167 cm, and 65 kg versus 60 kg, respectively.
Assessment of the first trimester screening data showed no significant differences between the groups with the exception of PAAP-A level, which was higher in the main group – 1.21 MоM versus 1.07 МоМ.
The detection rate of macrosomia (Ме (Q1; Q3)) was 5.7% (4.0; 9) in the comparison group versus 7.9% (5.9; 11.4) in the main group, р<0.0001, or the ratio was 1:17.5 (11; 25) versus 1:13 (9; 17), respectively, р<0.0001.
The next stage of the study was ROC analysis to evaluate the discriminatory ability of the model for prediction of macrosomia in population of the Russian women (Fig. 1).
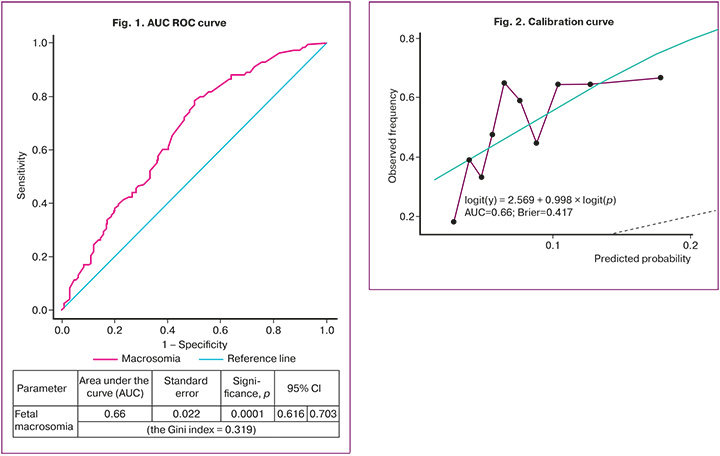
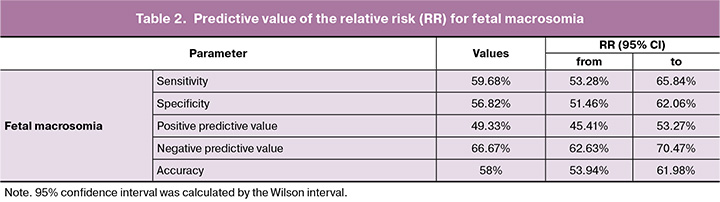
It was found that AUC for the ROC curve was 0.66 (95% CI 0.616–0.703, р<0.0001), the cutoff value was 0,434, the sensitivity was 59.68%, and the specificity was 56,82%. The positive predictive value was 49.33%, and the negative predictive value was 66.67%, accuracy was 58% (Table 2).
The next stage of the study was evaluation of model calibration using logistic regression, where the birth of a baby who was large for gestational age was considered as a dependent variable, and predicted probability was considered as an independent variable.
The green line in the calibration plot (Fig. 2) represents the ideal calibration curve. The black dots represent the mean of the observed frequency (along the y-axis) for a group of observations showing predicted probability in a given bin (along the x-axis). The violet line represents the empirical calibration curve based on the actual data. The dotted line represents continuation of the ideal line or the inversely transformed ideal line in logit space.
Analysis of the calibration plot showed that logit(y) = 2.569 + 0.998 × logit(p) represents linear regression, which is built in logit space, where:
logit(y) is the logit of the observed frequency (f) in bins;
logit(p) is the logit of the mean of predicted probability (p) in bins.
2.569 represents the calibration intercept. The value of 2.569 is very high. It indicates that the model systematically overestimates the probability of occurrence of the event.
0.998 represents the calibration slope. The value of 0.998 is close to 1, and indicates that the discriminatory ability of the model in logit space is consistent with the expected result.
AUC=0.66 is the area under the ROC curve. The value of 0.66 indicates that the discriminatory ability of the model is weak.
The Brier score=0.417 is a metric score for the average squared error for probabilistic forecast. The value of 0.417 indicates the average difference between predicted probabilities and the observed outcome frequency.
The calibration plot can be generally interpreted as follows: the model exhibits improper calibration, particularly for the low range of predicted probabilities, and seems to have overestimated probabilities of the event occurrence in the groups with low predicted probabilities. The calibraion slope in logit space is good. The coefficient of 0.998 is close to 1, suggesting that the discriminatory power of the model is maintained. The calibration intercept in logit space is high (2.569) and indicates a significant bias. The overall model performance is assessed as average. The AUC of 0.66 and the Brier score of 0.417 confirm that the model has limited predictive power and requires to improve calibration.
Discussion
Our study explored the discriminatory ability and predictive value of the FMF prediction model for fetal macrosomia in population of the Russian women.
It should be noted that this study is the first to explore the discriminatory ability of the FMF model in domestic and foreign scientific literature.
We explored the FMF model based on the study by Leona C.Y. et al. [7], who reported that maternal factors – height and weight, and fetal factors – crown-rump length (mm), nuchal translucency (mm), the levels of β-hCG (MoM) and PAPP-A (MoM) are associated with fetal macrosomia. Our study confirmed the differences between the comparison groups in maternal height and weight. However, there were no differences found in other explored parameters with the exception of РАРР-А level, which was higher in the LGA group – 1.21 versus 1.07 (р=0.02).
ROC analysis showed weak ability of the model to distinguish between the patients with high and low risk for LGA. AUC was 0.66, and the cutoff value was 0.434. Sensitivity was 59.68%, and specificity was 56.82%, The positive predictive value was 49.33%; the negative predictive value was 66.67%; the accuracy was 58%.
Analysis of the calibration curve showed that the calibration slope indicates preservation of proportionality between the predicted and observed values and shows no clear evidence of overfitting or probability distortion. At the same time, the calibration intercept reflects a significant systematic bias in the model toward underestimating the actual risk – the observed outcome frequency for all levels of predicted probability was significantly higher than expected. Decile analysis of the empirical calibration confirmed this pattern, demonstrating a sustained excess of the actual frequency of the event in relation to the nominal forecast. The Brier score reflected moderate quality of probabilistic predictions, while model performance for diagnostic discrimination remained limited. The results obtained in the study indicate that the model exhibits satisfactory relative risk retention (the calibration slope was near unity). However, it requires baseline risk adjustment (a positive intercept), and necessitates subsequent recalibration before application in clinical practice.
In our opinion, the differences in prediction accuracy are due to application of this model in different populations.
The strength of our study is that it is the first study evaluating the predictive value of the FMF model in clinical practice. However, we acknowledge that there are several limitations in the study. First, the sample size is small. Second, the study population represents Russian women. Consequently, the results of our study are inapplicable to other ethnic groups.
Conclusion
Our study provides valuable information about the discriminatory power of the prediction model for fetal macrosomia developed by the FMF. Although the model demonstrated low discriminatory power in population of the Russian women, further research is needed to optimize the predictive value of this model and determine its role in improving maternal and newborn outcomes. Future research should focus on finding the ways to improve the predictive value of fetal macrosomia screening models, increasing the sample size, and assessing the cost-effectiveness in clinical practice.
References
- Magee L.A., Brown M.A., Hall D.R., Gupte S., Hennessy A., Karumanchi S.A. et al. The 2021 International Society for the Study of Hypertension in Pregnancy classification, diagnosis & management recommendations for international practice. Pregnancy Hypertens. 2022; 27: 148-69. https://dx.doi.org/10.1016/j.preghy.2021.09.008
- www.fetalmedicine.org/research/assess/macrosomia
- Chagovets V., Frankevich N., Starodubtseva N., Tokareva A., Derbentseva E., Yuryev S. et al. Early prediction of fetal macrosomia through maternal lipid profiles. Int. J. Mol. Sci. 2025; 26(3): 1149. https://dx.doi.org/10.3390/ijms26031149
- Lu Q., Guo Z., Zhang J., Wang K., Tian Q., Liu S. et al. Performance of whole-genome promoter nucleosome profiling of maternal plasma cell-free DNA for prenatal noninvasive prediction of fetal macrosomia: a retrospective nested case-control study in mainland China. BMC Pregnancy Childbirth. 2022; 22(1): 698. https://dx.doi.org/10.1186/s12884-022-05027-w
- Du J., Zhang X., Chai S., Zhao X., Sun J., Yuan N. et al. Nomogram-based risk prediction of macrosomia: a case-control study. BMC Pregnancy Childbirth. 2022; 22(1): 392. https://dx.doi.org/10.1186/s12884-022-04706-y
- Yuan Y., Zhu Q., Yao X., Shi Z., Wen J. Maternal circulating metabolic biomarkers and their prediction performance for gestational diabetes mellitus related macrosomia. BMC Pregnancy Childbirth. 2023; 23(1): 113. https://dx.doi.org/10.1186/s12884-023-05440-9
- Leona C.Y., Karagiannis G., Stratieva V., Syngelaki A., Nicolaides K.H. First-trimester prediction of macrosomia. Fetal Diagn. Ther. 2011; 29(2): 139-47. https://dx.doi.org/10.1159/000318565
- Giouleka S., Tsakiridis I., Ralli E., Mamopoulos A., Kalogiannidis I., Athanasiadis A. et al. Diagnosis and management of macrosomia and shoulder dystocia: a comprehensive review of major guidelines. Obstet. Gynecol. Surv. 2024; 79(4): 233-41. https://dx.doi.org/10.1097/OGX.0000000000001253
- Bair C.A., Cate J., Chu A., Kuller J.A., Dotters-Katz S.K. Nondiabetic fetal macrosomia: causes, outcomes, and clinical management. Obstet. Gynecol. Surv. 2024; 79(11): 653-64. https://dx.doi.org/10.1097/OGX.0000000000001326
- Faul F., Erdfelder E., Lang A.-G., Buchner A. G*Power 3: a flexible statistical power analysis program for the social, behavioral, and biomedical sciences. Behav Res Methods. 2007; 39(2): 175-91. https://dx.doi.org/10.3758/BF03193146
- Министерство здравоохранения Российской Федерации. Клинические рекомендации. Нормальная беременность. М.; 2020. 80 с. [Ministry of Health of the Russian Federation. Clinical guidelines. A normal pregnancy. Moscow; 2020. 80 p. (in Russian)].
- Stevens R.J., Poppe K.K. Validation of clinical prediction models: what does the “calibration slope” really measure? J. Clin. Epidemiol. 2020; 118: e93-9. https://dx.doi.org/10.1016/j.jclinepi.2019.09.016
- Середа А.П., Андрианова М.А. Рекомендации по оформлению дизайна исследования. Травматология и ортопедия в России. 2019; 25(3): 165-84. [Sereda A.P., Andrianova M.A. Study design guidelines. Traumatology and orthopedics of Russia. 2019; 25(3): 165-84. (in Russian)]. https://dx.doi.org/10.21823/2311-2905-2019-25-3-165-184
Received 28.10.2025
Accepted 12.02.2026
About the Authors
Oleg V. Tysyachny, PhD, Researcher at the 1st Maternity Department, V.I. Kulakov National Medical Research Center for Obstetrics, Gynecology and Perinatology,Ministry of Health of Russia, 117997, Russia, Moscow, Oparina str., 4, o_tysyachny@oparina4.ru, https://orcid.org/ 0000-0001-9282-9817
Andrey Yu. Romanov, PhD, Head of the Department of Planning and Support of Scientific Projects, V.I. Kulakov National Medical Research Center for Obstetrics,
Gynecology and Perinatology, Ministry of Health of Russia, 117997, Russia, Moscow, Oparina str., 4, romanov1553@yandex.ru
Oleg R. Baev, Dr. Med. Sci., Professor, Head of the 1st Maternity Department, V.I. Kulakov National Medical Research Center for Obstetrics, Gynecology and Perinatology, Ministry of Health of Russia, 117997, Russia, Moscow, Oparina str., 4; Professor at the Department of Obstetrics, Gynecology, Perinatology, and Reproductology,
I.M. Sechenov First Moscow State Medical University, Ministry of Health of Russia, o_baev@oparina4.ru, https://orcid.org/0000-0001-8572-1971
Lyudmila Yu. Grebenshchikova, PhD, Head of the Department of Reproductive Medicine and Perinatology, Tver State Medical University, Ministry of Health of Russia;
General Director, Medical Center «Consilium», 170039, Russia, Tver, Pozharnaya sqr., 3, +7(4822)368550, ludmilazdrav@mail.ru, klinika.concilium@mail.ru,
https://orcid.org/0000-0003-2815-1882
Similar Articles