Features of serum lipidome in pregnant women with fetal macrosomia and a concurrence of macrosomia with gestational diabetes mellitus
Objective. To elaborate an analytical approach to predicting fetal macrosomia (FM) on the basis of maternal serum lipidome analysis.Odinokova V.A., Chagovets V.V., Shmakov R.G., Starodubtseva N.L., Salimova D.F., Kononikhin A.S., Frankevich V.E.
Subjects and methods. A prospective cohort study enrolled 120 pregnant women with FM and gestational diabetes mellitus (GDM). Serum lipid levels were analyzed by mass spectrometry.
Results. The best prognostic models were obtained at 11-14 and 24-28 weeks’ gestation in women with GDM (the sensitivity and specificity were 0.91/0.96 and 0.93/0.96, respectively), at 11-14 weeks in the entire group and in patients without GDM (0.85/0.91 and 0.93/0.92). The findings make it possible to predict FM according to the presence or absence of GDM.
Conclusion. The introduction of the developed models into obstetric practice will become a new tool for assessing the risk for FM, which will be able to reduce its rate and to improve maternal and perinatal outcomes.
Keywords
fetal macrosomia
gestational diabetes mellitus
mass spectrometry
lipidomics
phospholipids
According to domestic and foreign authors, the frequency of fetal macrosomia (FM) is, on average, 9–10%; in individual ethnic groups it can reach 36% [1–4]. Childbirth with FM is characterized by a high frequency of labor abnormalities, a cephalopelvic disproportion, third and fourth degree perineal ruptures [5], hypotonic bleeding. FM is bound to an increase in the frequency of labor induction, cesarean section (CS) and instrumental delivery [6]. Among neonatal complications, shoulder dystocia [7], tubular bone fractures, brachial plexus damage, acute fetal hypoxia, electrolyte and metabolic disorders [8, 9] should be noted.
Most researchers use the term “large fetus” or “fetal macrosomy” to mean body weight at birth of more than 4000 g [10]. Newborns with a body weight at birth of more than 90 percentiles for a given gestational period are called large to the gestational age [11, 12].
A key factor determining the development of FM is a disorder of carbohydrate and fat metabolism in the mother’s body. Considering the prevalence of gestational diabetes mellitus (GDM) among all diabetic pregnancies (86%) and the high incidence of FM in GDM (15–45%), this problem is a subject of scientific interest among researchers [13, 14]. Nevertheless, the results of the studies showed a positive correlation between the level of triacylglycerides (TAGs), fatty acids and fetal weight in pregnant women with controlled GDM [14, 15]. This suggests that lipid levels have an important effect on the development of FM.
Of particular interest are the studies in the field of lipidomics, a science engaged in the quantitative analysis of the entire variety of lipids (lipidomes) in the biological system. Mass spectrometry is a modern method for studying lipidomes, which makes it possible to identify lipids and determine their relative level in a sample. Currently, the study of blood lipidome is considered as an accessible and promising research object for the early diagnosis of macrosomia in pregnant women [16].
Thus, the search for biomarkers for early prognosis of FM is relevant. The development of a patient management algorithm will allow us to form high-risk groups of FM development for careful clinical and diagnostic monitoring, to introduce preventive and therapeutic measures aimed at reducing the frequency of FM, thereby improving maternal and perinatal outcomes.
The purpose of the study was to assess the differences between serum lipidome taken at different stages of pregnancy in patients who developed or did not develop fetal macrosomia.
Materials and Methods
This was a prospective cohort study conducted in 2017–2018 in Academician V.I. Kulakov National Medical Research Center for Obstetrics, Gynecology and Perinatology, Ministry of Health of Russia, Moscow. The study included 950 women aged 18 to 45 years who underwent prenatal screening in the first trimester of pregnancy. After signing the informed consent, the patients underwent blood sampling from the cubital vein in three periods: 11–14 weeks, 24–28 weeks, 30–32 weeks of pregnancy. Inclusion criteria in the study were patients aged 18–45 years, Caucasian race, singleton pregnancy, signed informed consent. Exclusion criteria were multiple pregnancy, diabetes mellitus (DM) type 1 and 2, preeclampsia (PE), the presence of any somatic pathology in the decompensation stage, cancer, autoimmune diseases, premature birth, low birth weight newborns. Patients with whom communication was lost, who did not pass the oral glucose-tolerance test at the period of 24–28 weeks, who missed at least one blood sampling in accordance with the established deadlines were excluded from the study. As a result, 120 patients met the established criteria and were selected for subsequent mass spectrometric analysis. They were enrolled in two groups depending on the weight of the child at birth: group 1 - patients with FM (m> 4000 g, n = 40), group 2 - with normal body weight of the newborn (m = 2501-3999 g, n = 80). Each group was divided into two subgroups (1a, 1b, 2a, 2b) depending on the presence or absence of GDM. Subgroup 1a included patients with FM without GDM (n = 30), 1b - with FM and the presence of GDM (n = 10); subgroup 2a included healthy patients with normal birth weight babies (control, n = 50), subgroup 2b consisted of patients with normal fetal weight and GDM (n = 30). A semi-quantitative assessment of serum lipid levels (n = 360) was performed by mass spectrometry with electrospray ionization.
The adequacy of the sample size was determined using the following formula:

where N is the sample size, Zα/2 и Zβ are the values of the normal distribution with probabilities α/2 and β, respectively, d is the difference of group mean values, SD is the standard deviation. The significance level was chosen equal to 0.05 and the power of the criterion was equal to 0.8. Under these conditions, Zα/2 + Zβ = 2.8. The method of mass spectrometry with electrospray allows you to get a result with a relative standard deviation of about 10%. The value of the d / SD ratio in this study was equal to 1.3. Hence, the sample size should be at least 10 people in each group.
A comprehensive examination of women included taking clinical and medical history, an oral glucose tolerance test at the period of 24–28 weeks. GDM was diagnosed with a glucose tolerance test with 75 g of glucose between 24–28 weeks of gestation, as recommended by the International Association for the Study of Diabetes during Pregnancy (IADPSG), unless GDM has been verified before.
Blood serum was centrifuged for 10 min at 700 g and 4° C, the supernatant was frozen in cryovials and stored at -80° C. Lipid extracts were obtained in accordance with the modified Folch method. Then, 480 μl of a mixture of chloroform-methanol (2:1, v/v) was added to 40 μl of blood serum, the mixture was incubated for 10 min, filtered using filter paper, and 150 μl of an aqueous NaCl solution was added (1 mol/L). The mixture was centrifuged at 3000 rpm for 5 minutes at ambient temperature. The organic lipid-containing bottom layer was selected and dried in a stream of nitrogen, then it was redissolved in a mixture of acetonitrile-2-propanol (1:1, v/v) for subsequent mass spectrometric analysis.
The molecular composition of the samples was determined using electrospray ionization mass spectrometry using a Maxis Impact qTOF mass spectrometer (Bruker Daltonics, Bremen, Germany). Mass spectra were obtained in the mode of positive ions in the range 400–1000 m/z with the following settings: voltage at the capillary 4.1 kV, pressure of the spraying gas 0.7 bar, flow rate of the drying gas 6 L/min, temperature of the drying gas 200o C. To identify the compounds that make up the sample, tandem mass spectrometry was performed.
Lipid peaks were identified using the R code created in the laboratory, which is necessary for comparing the measured m/z values with the exact masses calculated from the elemental composition and assigning identification when the experimental and theoretical masses coincide within 10 ppm. The permissible parameters of each acyl or alkyl chain of complex lipids are as follows: the number of carbon atoms in the range of 10–26 and the number of double bonds in the range of 0–6. The adducts of lipid molecules with a proton and ammonium cation were examined. A more accurate identification was carried out according to the results of the tandem mass spectrometric analysis of the peak in question. The nomenclature of lipids corresponded to the terminology of Lipid Maps [17] and abbreviated notation [18].
For statistical processing of the results, scripts written in the R language [19] and the RStudio program [20] were used. Multivariate mass spectrometric data were processed using OPLS-DA multivariate analysis (discriminant analysis using orthogonal projections onto hidden structures) [21]. OPLS-DA analysis was implemented using the ropls package [22]. Models were created to classify samples based on the presence or absence of macrosomia. The quality of the OPLS-DA model was evaluated by its ability to describe the variance of the analyzed data (R2) and predict possible new data (Q2). The parameter Q2 was calculated by 7-fold cross-validation. To evaluate the significance of Q2 and R2, a 100-fold permutation criterion was used. The characteristics of the model were assessed by the values of sensitivity, specificity, and area under the ROC curve (AUC). In addition, OPLS-DA was used to identify lipids that are most significant for classification. This is done by analyzing the effect of the variable on the projection (VIP). For lipids identified by VIP analysis, the statistical significance of differences in their levels between the studied groups was evaluated. Statistical analysis was performed using the Mann – Whitney test. To describe the quantitative data, the median (Me) and the quartiles Q1 and Q3 were used. The value of the threshold significance level p was equal to 0.05.
Results and Discussion
The blood serum lipid extracts of 120 patients obtained in the 1st, 2nd and 3rd trimesters of pregnancy (n = 360) were analyzed by mass spectrometry to determine the molecular characteristics of the serum in patients with FM compared to the norm. At the initial stage, we evaluated the possibility of classifying the obtained samples according to the parameter of FM presence – absence based on the lipid composition in different periods of pregnancy (11–14 weeks, 24–28 weeks, 30–32 weeks). At the second stage, a similar approach was used in the subgroups (1a, 1b, 2a, 2b), which made it possible to distinguish between serum of pregnant women with FM and those with the combination of FM with GDM. Evaluation was performed using the multivariate analysis method OPLS-DA. Figure 1 shows a typical view of the chart of accounts, based on the results of OPLS-DA. In this case, a graph of OPLS-DA analysis accounts is presented for the data from samples of the general subgroup taken at 11 weeks’ gestation. The points corresponding to samples obtained from patients with FM and normal body weight at birth were well divided into two clusters. A good separation is observed for the two groups, which is evident of significant differences in the lipid profile of the compared samples. Significant differences of the lipid profile are already noticeable in the first trimester in patients with developing FM in comparison with the control group.
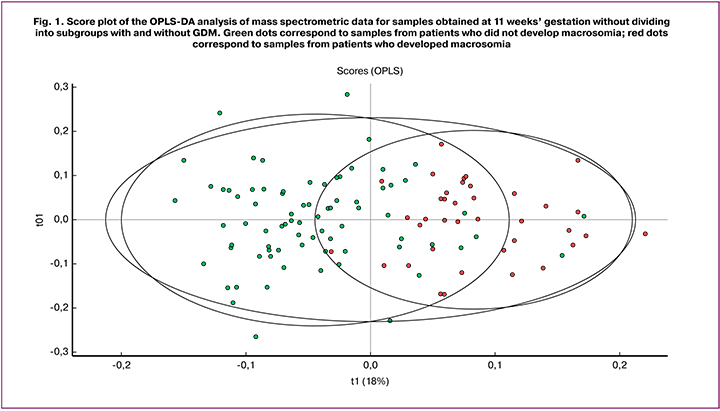
The quality of the resulting models was evaluated by their ability to describe (R2) and predict (Q2) data variance. The model under consideration is characterized by R2Y = 0.509 Q2 = 0.418. Although Q2 does not have a standard for comparison or a specific threshold for determining significance other than a theoretical maximum equal to 1, but in the literature, there is an empirically deduced allowable value for biological models Q2 > 0.4.
Thus, we can conclude that this model can be used to classify serum samples and predict the FM development during blood sampling in the first trimester screening. This allows us to determine the high-risk group of FM development. For this group of patients, it is necessary to recommend undergoing a glucose tolerance test in the first trimester of pregnancy in order to detect GDM timely and initiate therapeutic interventions, as well as careful clinical monitoring of patients with normoglycemia.
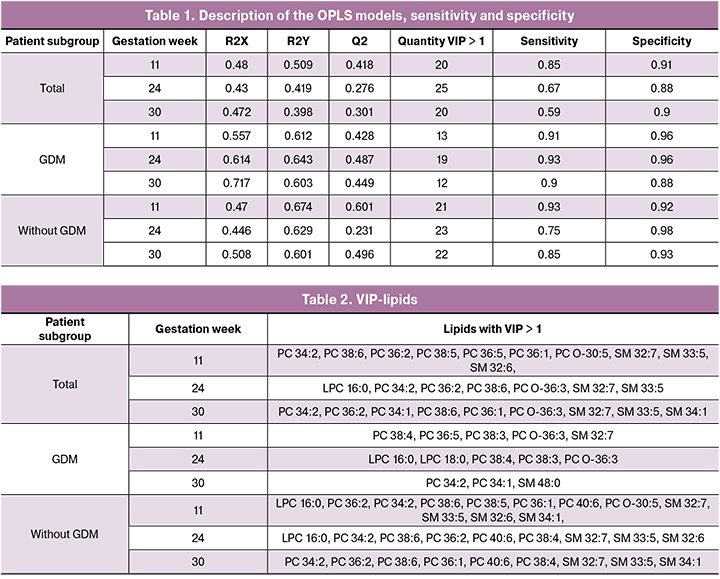
Of particular interest are the results obtained in the classification of four subgroups (1a, 1b, 2a, 2b) at different stages of pregnancy, when there is the information on the presence of GDM. The characteristics of the developed models are summarized in Table 1. The parameters of most models exceed the threshold value Q2> 0.4 and are suggestive of good prognostic ability in patients with FM and GDM at all stages of pregnancy. The low Q2 value characterizes the models created for blood serum taken at 24 and 30 weeks’ gestation from the patients of the general subgroup, and at 24 weeks’ gestation obtained from the subgroup without GDM.
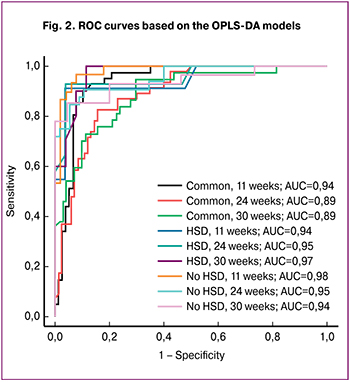 Figure 2 demonstrates ROC-curves for each of the created models, as well as the area under them (AUC). All AUC values were no less than 0.89. In addition, an assessment of the sensitivity and specificity of OPLS-DA models was calculated (Table 2). The model created for samples of the general subgroup which were collected at 30 weeks’ gestation demonstrates the lowest sensitivity (0.59). The models for samples of the general subgroup and subgroup with GDM, collected at 24 and 30 weeks’ gestation revealed the lowest specificity (0.88). The model with the highest sensitivity was obtained for samples of the subgroup with and without GDM collected at 24 and 11 weeks’ gestation, respectively. The model with the highest specificity was created for samples of the subgroup with GDM collected at 24 weeks’ gestation. On substituting individual patients’ new samples into the developed models of lipidome data, one can obtain the result of how the samples fit one of the groups used to construct the corresponding model. The choice of model is determined by the period at which the sample was obtained and the result of the glucose tolerance test. The obtained data make it possible to classify FM depending on the presence or absence of GDM, and it is recommended to perform a lipidome analysis of blood serum in both I and II trimesters.
In addition to creating classification models, the OPLS-DA method allows us to identify biological factors (in this case, lipids) that facilitate the sorting of samples into groups. This can be done on the basis of the so-called VIP parameter. Factors with VIP> 1 are most significant. Based on this analysis, it is possible to determine the molecules characterizing the studied groups for the subsequent study of the pathology development mechanisms. The number of mass spectrometric peaks with VIP> 1 for each of the models is shown in Table 1. After identification and analysis using Mann – Whitney test, lipids were determined whose levels are statistically significantly different in groups with FM and normal fetal mass. Figure 3 shows the box diagram of lipids with VIP> 1, based on the model for samples of the general subgroup obtained at 11 weeks’ gestation, the graph of which is shown in Figure 1. These lipids belong to the following classes: phosphatidylcholines, plasmalogens and sphingomyelins. Lipids with VIP> 1 and with a statistically significant difference between groups for other models are summarized in Table 2.
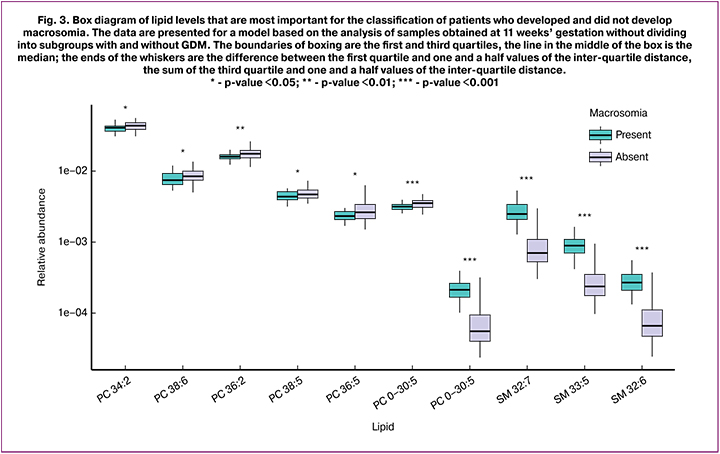
In general, all statistically significant identified lipids belong to the group of phospholipids: phosphatidylcholines, sphingomyelins, lysophosphatidylcholines and plasmalogens. Phospholipids are highly specialized lipids, as well as indispensable growth and development factors necessary for the functioning of all cells without exception. Recently, more and more attention has been paid to the exchange of phospholipids, which play an important pathogenetic role in the development of metabolic diseases.
Lysophosphatidylcholines are phosphatidylcholine hydrolysis products catalyzed by phospholipase A2. In a study by Barber M. et al. [23], conducted in a small sample, plasma concentrations of lysophosphatidylcholines were reduced in individuals with obesity and type 2 diabetes. In addition, lysophosphatidylcholine (LPC 18: 2) was proposed as an independent predictor of type 2 diabetes [24, 25].
Some researchers have shown the role of sphingomyelins in the development of insulin resistance, whose adipocyte levels are positively correlated with insulin levels and the insulin resistance index (HOMA-IR) in overweight individuals [25, 26].
In their study, Patel N. et al. [27] demonstrated a positive correlation between the levels of phosphatidylcholine and lysophosphatidylcholine in cord blood and the body weight of the children born to mothers with obesity (0.04; 0.02-0.07), as well as weight gain in children in the first 6 months of life (0.05; 0.00-0.10). High levels of lysophosphatidylcholine (LPCs) were linearly associated with hyperglycemia in women at 28 weeks’ gestation (16: 1 (β = 0.65; 95% CI: 0.03-0.10) and 18: 1 (0.52; 0.02-0.80)).
Conclusion
A lipidome analysis of blood serum reveals differences in the lipid profile in pregnant women with FM and normal fetal weight already in early pregnancy (11-14 weeks), the sensitivity and specificity of the developed mathematical model were 85% and 91%, respectively. Moreover, the data on the level of glucose in the blood with a load test (glucose tolerance test) increase the accuracy of determining the high-risk group of FM development: for the group with GDM, the sensitivity and specificity of the model were 91% and 96% for blood samples in the first trimester of pregnancy. That is, already at the early stages of pregnancy, a lipidome analysis of blood makes it possible to identify the high-risk group of FM development. The development of the models can lead to the creation of macrosomia risk assessment methods, which will reduce its frequency and improve maternal and perinatal outcomes. In the future, not only diagnostic approaches can be proposed, but also new management algorithms for pregnant women with FM. The analysis of the characteristics of serum lipidome expands the possibilities of studying the molecular processes that cause FM, understanding of which will subsequently reveal the key links in the pathogenesis of this complication.
References
- Wassimi S., Wilkins R., Mchugh N.G.L., Xiao L., Simonet F., Luo Z.C. Association of macrosomia with perinatal and postneonatal mortality among First Nations people in Quebec. Can. Med. Assoc. J. 2011; 183(3): 322–6. https://dx.doi.org/10.1503/cmaj.100837
- García-De la Torre J.I., Rodríguez-Valdez A., Delgado-Rosas A. Risk factors for fetal macrosomia in patients without gestational diabetes mellitus. Ginecol. Obstet. Mex. 2016; 84(3): 164–71.
- Luhete P.K., Mukuku O., Kiopin P.M., Tambwe A.M., Muenze P.K. Macrosomie fœtale à Lubumbashi: facteurs de risque et pronostic maternel et périnatal. Pan Afr. Med. J. 2016; 23: 166. https://dx.doi.org/10.11604/pamj.2016.23.166.7362
- Chiavaroli V., Castorani V., Guidone P., Derraik J.G.B., Liberati M., Chiarelli F., Mohn A. Incidence of infants born small- and large-for-gestational-age in an Italian cohort over a 20-year period and associated risk factors. Ital. J. Pediatr. 2016; 42: 42. https://dx.doi.org/10.1186/s13052-016-0254-7
- Eskandar O., Shet D. Risk factors for 3rd and 4th degree perineal tear. J. Obstet. Gynaecol. 2009; 29(2): 119–22. https://dx.doi.org/10.1080/01443610802665090
- Бресский А.Г., Радецкая Л.Е., Мацуганова Т.Н., Прусакова О.И. Исходы родов у женщин с крупным плодом. В кн.: Достижения фундаментальной, клинической медицины и фармации. Материалы 71-й научной сессии сотрудников университета. 27–28 января 2016. Витебск: ВГМУ; 2016: 171–2.[Bresskii A.G., Radetskaya L.E., Matsuganova T.N., Prusakova O.I. Iskhody rodov u zhenshchin s krupnym plodom. In: Dostizheniya fundamental’noi, klinicheskoi meditsiny i farmatsii. Materialy 71-i nauchnoi sessii sotrudnikov universiteta. 27–28 January, 2016. Vitebsk: VGMU; 2016: 171–2. (in Russian).]
- Gabbe S., Niebyl J., Simpson J., Landon M., Galan H., Jauniaux E. et al. Obstetrics: normal and problem pregnancies. 7th ed. Saunders Elsevier; 2017.
- Executive summary: Neonatal brachial plexus palsy. Report of the American College of Obstetricians and Gynecologists’ Task Force on Neonatal Brachial Plexus Palsy. Obstet. Gynecol. 2014; 123(4): 902–4. https://dx.doi.org/10.1097/01.AOG.0000445582.43112.9a
- Wang D., Hong Y., Zhu L., Wang X., Lv Q., Zhou Q. et al. Risk factors and outcomes of macrosomia in China: a multicentric survey based on birth data. J. Matern. Fetal Neonatal Med. 2017; 30(5): 623–7. https://dx.doi.org/10.1080/14767058.2016.1252746
- Knop M.R., Geng T., Gorny A.W., Ding R., Li C., Ley S.H., Huang T. Birth weight and risk of type 2 diabetes mellitus, cardiovascular disease, and hypertension in adults: a meta-analysis of 7 646 267 participants from 135 studies. J. Am. Heart Assoc. 2018; 7(23): e008870. https://dx.doi.org/10.1161/JAHA.118.008870
- Henriksen T. The macrosomic fetus: a challenge in current obstetrics. Acta Obstet. Gynecol. Scand. 2008; 87(2): 134–45. https://dx.doi.org/10.1080/00016340801899289
- Walsh J.M., McAuliffe F.M. Prediction and prevention of the macrosomic fetus. Eur. J. Obstet. Gynecol. Reprod. Biol. 2012; 162(2): 125–30. https://dx.doi.org/10.1016/j.ejogrb.2012.03.005
- Jameson J.L., De Groot L.J., de Kretser D.M., Giudice L.C., Grossman A.B., Melmed S. et al. Endocrinology: adult and pediatric. vol. 1-2. Saunders Elsevier; 2016.
- Schaefer-Graf U.M., Meitzner K., Ortega-Senovilla H., Graf K., Vetter K., Abou-Dakn M., Herrera E. Differences in the implications of maternal lipids on fetal metabolism and growth between gestational diabetes mellitus and control pregnancies. Diabet. Med. 2011; 28(9): 1053–9. https://dx.doi.org/10.1111/j.1464-5491.2011.03346.x
- Schaefer-Graf U.M., Graf K., Kulbacka I., Kjos S.L., Dudenhausen J., Vetter K., Herrera E. Maternal lipids as strong determinants of fetal environment and growth in pregnancies with gestational diabetes mellitus. Diabetes Care. 2008; 31(9): 1858–63. https://dx.doi.org/10.2337/dc08-0039
- Ciborowski M., Zbucka-Kretowska M., Bomba-Opon D., Wielgos M., Brawura-Biskupski-Samaha R., Pierzynski P. Potential first trimester metabolomic biomarkers of abnormal birth weight in healthy pregnancies. Prenat. Diagn. 2014; 34(9): 870–7. https://dx.doi.org/10.1002/pd.4386
- Sud M., Fahy E., Cotter D., Brown A., Dennis E.A., Glass C.K. et al. LMSD: LIPID MAPS structure database. Nucleic Acids Res. 2007; 35 (Database issue): D527-32. https://dx.doi.org/10.1093/nar/gkl838
- Liebisch G., Vizcaíno J.A., Köfeler H., Trötzmüller M., Griffiths W.J., Schmitz G. et al. Shorthand notation for lipid structures derived from mass spectrometry. J. Lipid Res. 2013; 54(6): 1523-30. https://dx.doi.org/10.1194/jlr.M033506
- Team R.C. R: A language and environment for statistical computing. R Foundation for statistical computing. Vienna, Austria; 2015. Available at: https://www.r-project.org/
- RStudio: Integrated development for environment R. Available at: http://www.rstudio.com/
- Wold S., Sjöström M., Eriksson L. PLS-regression: a basic tool of chemometrics. Chemom. Intell. Lab. Syst. 2001; 58: 109–30. https://dx.doi.org/10.1016/S0169-7439(01)00155-1
- Thevenot E.A., Roux A., Xu Y., Ezan E., Junot C. Analysis of the human adult urinary metabolome variations with age, body mass index, and gender by implementing a comprehensive workflow for univariate and OPLS statistical analyses. J. Proteome Res. 2015; 14(8): 3322–35. https://dx.doi.org/10.1021/acs.jproteome.5b00354
- Barber M.N., Risis S., Yang C., Meikle P.J., Staples M., Febbraio M.A., Bruce C.R. Plasma lysophosphatidylcholine levels are reduced in obesity and type 2 diabetes. PLoS One. 2012; 7(7): e41456. https://dx.doi.org/10.1371/journal.pone.0041456
- Floegel A., Stefan N., Yu Z., Muhlenbruch K., Drogan D., Joost H.G. et al. Identification of serum metabolites associated with risk of type 2 diabetes using a targeted metabolomic approach. Diabetes. 2013; 62(2): 639–48. https://dx.doi.org/10.2337/db12-0495.
- Suvitaival T., Bondia-Pons I., Yetukuri L., Pöhö P., Nolan J.J., Hyötyläinen T. et al. Lipidome as a predictive tool in progression to type 2 diabetes in Finnish men. Metabolism. 2018; 78: 1–12. https://dx.doi.org/10.1016/j.metabol.2017.08.014
- Zeghari N., Vidal H., Younsi M., Ziegler O., Drouin P., Donner M. Adipocyte membrane phospholipids and PPAR-γ expression in obese women: relationship to hyperinsulinemia. Am. J. Physiol. Metab. 2000; 279(4): E736–43. https://dx.doi.org/10.1152/ajpendo.2000.279.4.E736
- Patel N., Hellmuth C., Uhl O., Godfrey K., Briley A., Welsh P. et al. Cord metabolic profiles in obese pregnant women: insights into offspring growth and body composition. J. Clin. Endocrinol. Metab. 2018; 103(1): 346–55. https://dx.doi.org/10.1210/jc.2017-00876
Received 03.06.2019
Accepted 21.06.2019
About the Authors
Victoriya A. Odinokova, postgraduate student, National Medical Research Center of Obstetrics, Gynecology and Perinatology named after Acad. V.I. Kulakov,Ministry of Health of Russia. Tel.: +7(905)724-02-64. E-mail: v_odinokova@oparina4.ru
Address: 117997 Russian Federation, Moscow, Oparin Street, 4.
Vitaliy V. Chagovets, PhD, Senior Researcher of the Laboratory of Proteomics and Metabolomics in Human Reproduction at the Department of Systems Biology in Reproduction Kulakov National Medical Research Center of Obstetrics, Gynecology, and Perinatology, Ministry of Health of Russia. Tel.: +7 (926) 562-65-90.
E-mail: vvchagovets@gmail.com.
Address: 117997 Russian Federation, Moscow, Oparin Street, 4.
Roman G. Shmakov, MD, professor of the Russian Academy of Sciences, National Medical Research Center of Obstetrics, Gynecology and Perinatology named
after Acad. V.I. Kulakov, Ministry of Health of Russia, Moscow. Tel.: +74954387200. E-mail: r_shmakov@oparina4.ru
Address: 117997 Russian Federation, Moscow, Oparin Street, 4.
Dinara Failievna Salimova, specialist of the laboratory of proteomics and metabolomics in human reproduction at the department of systems biology in reproduction.
Kulakov National Medical Research Center of Obstetrics, Gynecology, and Perinatology, Ministry of Health of Russia. Tel.: +7 (926)562-65-90.
E-mail: Salimova.1993@mail.ru Address: 117997 Russian Federation, Moscow, Oparin Street, 4.
Nataliya L. Starodubtseva, PhD, head of laboratory of proteomics of human reproduction, Federal State Budget Institution «Research Center for Obstetrics, Gynecology and Perinatology» Ministry Of Healthcare of the Russian Federation. Tel.: +7(916) 463-98-67, e-mail: n_starodubtseva@oparina4.ru.
Address: 117997 Russian Federation, Moscow, Oparin Street, 4.
Alexey S. Kononikhin, PhD, researcher of the laboratory of proteomics and metabolomics in human reproduction at the department of systems biology in reproduction. Kulakov National Medical Research Center of Obstetrics, Gynecology, and Perinatology, Ministry of Health of Russia. Tel.: +7 (926)562-65-90. E-mail: konoleha@yandex.ru
Address: 117997 Russian Federation, Moscow, Oparin Street, 4.
Vladimir E. Frankevich, PhD, Head of Department of Systems Biology in Reproduction, Federal State Budget Institution «Research Center for Obstetrics, Gynecology and Perinatology» Ministry Of Healthcare of the Russian Federation
Tel.: +7(495) 438-0788;-2198. E-mail: v_frankevich@oparina4.ru
Address: 117997 Russian Federation, Moscow, Oparin Street, 4.
For citation: Odinokova V.A., Chagovets V.V., Shmakov R.G., Starodubtseva N.L., Salimova D.F., Kononikhin A.S., Frankevich V.E. Features of serum lipidome in pregnant women with fetal macrosomia and a concurrence of macrosomia with gestational diabetes mellitus.
Akusherstvo i Ginekologiya/ Obstetrics and gynecology. 2019; 12: 46-53. (In Russian).
https://dx.doi.org/10.18565/aig.2019.12.46-53
Similar Articles