
Macrophage cell populations in infertile women
Merkulov E.D., Svarovsky D.A., Samoilova Yu.G., Spirina L.V., Stakheeva M.N., Okkel Yu.V., Sidorenkova K.A., Petrov I.A., Prozorova A.V., Sulim V.V., Ulyanova A.S., Kubykina M.I., Arkhipova Ya.I.
Infertility remains a major medical and social challenge that affects a substantial proportion of the reproductive-age population. One of the factors influencing the outcome of in vitro fertilization (IVF) is the status of the immune microenvironment and phenotypic plasticity of macrophages involved in the regulation of inflammation, implantation, and early embryonic development.
Objective. To investigate the phenotypic characteristics of in vitro-induced peripheral blood macrophages in infertile women, their responsiveness to polarizing stimuli (lipopolysaccharide [LPS] and IL-4), and their association with embryo quality in IVF cycles.
Materials and methods. This study included women with various forms of infertility who underwent IVF. Lipopolysaccharide (LPS) and interleukin (IL)-4 were used to induce macrophage activation. The CD68+HLA-DR+CD80+/- and CD68+CD163+/-CD206+/- macrophage subpopulations were analyzed using flow cytometry. The concentration of tumor necrosis factor alpha (TNF-α) in the cell culture supernatants was determined using an enzyme-linked immunosorbent assay (ELISA).
Results. Poor embryo quality was associated with a predominance of incompletely activated CD68+HLA-DR+CD80− macrophages, whereas high embryo quality was associated with increased proportions of both classical M1 macrophages (CD68+HLA-DR+CD80+) and alternatively activated CD68+CD163−CD206+ macrophages. TNF-α concentrations reached their highest levels following LPS stimulation, with the highest values observed in women with excellent-quality embryos. Anovulatory infertility was characterized by a significantly higher proportion of CD68+HLA-DR−CD80+ macrophages than in other infertility subtypes. Correlation analysis confirmed the existence of a continuum of macrophage polarization, reflecting the balance between mature and immature macrophage subpopulations.
Conclusion. The phenotypic composition and functional responsiveness of macrophages are closely associated with embryo quality during IVF. The identified characteristics define an immunological profile with prognostic potential and may serve as the basis for personalized approaches to infertility treatment.
Authors' contributions. Merkulov E.D., Svarovsky D.A. – conception and design of the study, data analysis and interpretation; Spirina L.V., Stakheeva M.N. – scientific supervision, methodological support, writing and editing of the article;
Samoilova Yu.G., Okkel Yu.V., Petrov I.A. – clinical support of the study, formation of patient groups, analysis of clinical data; Sulim V.V., Ulyanova A.S. – experimental studies, cell culture management; Sidorenkova K.A., Prozorova A.V., Kubykina M.I., Arkhipova Ya.I. – collection of clinical and laboratory material, systematization of clinical and embryological data. All authors approved the final version of the manuscript prior to publication and agree to be accountable for all aspects of the work, ensuring that questions related to the accuracy or integrity of any part are appropriately investigated and resolved.
Conflicts of interest: The authors have no conflicts of interest to declare.
Funding: The study was conducted with financial support from the Siberian State Medical University of the Ministry of Health.
Ethical approval: The study was reviewed and approved by the Research Ethics Committee of the Siberian State Medical University of the Ministry of Health (Ref. No: 8 of 18.01.2023).
Use of generative artificial intelligence: No artificial intelligence tools were used in the preparation of this manuscript.
Patient consent for publication: All patients provided informed consent for the publication of their data.
Authors' data sharing statement: The data supporting the findings of this study are available upon request from the corresponding author after approval from the principal investigator.
For citation: Merkulov E.D., Svarovsky D.A., Samoilova Yu.G., Spirina L.V., Stakheeva M.N., Okkel Yu.V.,
Sidorenkova K.A., Petrov I.A., Prozorova A.V., Sulim V.V., Ulyanova A.S., Kubykina M.I., Arkhipova Ya.I.
Macrophage cell populations in infertile women.
Akusherstvo i Ginekologiya/Obstetrics and Gynecology. 2026; (7): 114-134 (in Russian):
https://dx.doi.org/10.18565/aig.2025.291
Keywords
follicular fluid
macrophages
monocytes
embryos
cytokines
IVF
According to the 2022 report of the Assisted Reproductive Technologies (ART) Registry of the Russian Association of Human Reproduction, the clinical pregnancy rate was 26.4% per embryo transfer in in vitro fertilization (IVF) programs [1]. Increasing attention has been directed toward the immunological aspects of infertility, particularly the role of innate immunity in ovulation, fertilization, and implantation [2]. As key effector cells of the innate immune response, macrophages actively participate in remodeling the immune microenvironment required for successful implantation and embryonic development. Their ability to undergo phenotypic plasticity toward either a proinflammatory M1-like or an anti-inflammatory M2-like phenotype has a substantial impact on reproductive function [2].
Several studies have demonstrated that disruption of the balance between M1 and M2 macrophages may be associated with pathological conditions such as endometriosis, chronic endometritis, recurrent pregnancy loss, and reduced efficacy of assisted reproductive technology (ART) programs [3,4]. Moreover, the functional status and phenotype of peripheral blood macrophages reflect the overall immune status of the individual, providing an opportunity to predict IVF outcomes during the preimplantation period [5]. Activation of macrophages through Toll-like receptor 4 (TLR4), for example, following exposure to lipopolysaccharide (LPS), induces the production of pro-inflammatory cytokines, including tumor necrosis factor alpha (TNF-α) and interleukin (IL)-6. These cytokines play a dual role: they are essential for initiating the inflammatory response; however, when produced in excess, they may impair ovulation and reduce endometrial receptivity [6]. Conversely, IL-4 stimulation promotes polarization toward the M2 phenotype, which supports immune tolerance and creates a favorable environment for embryo implantation [7].
Currently, the routine immunological assessment of women undergoing IVF is generally limited to measuring circulating cytokine concentrations or peripheral blood immune cell subsets, such as lymphocytes and monocytes, without evaluating their functional responses to specific in vitro stimuli [8]. In contrast, modeling the activation potential of monocytes and their polarization in vitro, for example, through stimulation with LPS and IL-4, may provide a more accurate approach to predicting reproductive outcomes.
This study aimed to investigate the phenotypic characteristics of the peripheral blood monocyte pool in response to polarizing stimuli (IL-4 and LPS) in women with infertility undergoing IVF.
Materials and methods
The study included 58 women who underwent treatment at the ART Center of the Siberian State Medical University, Ministry of Health of the Russian Federation in Tomsk. The mean age of the participants was 36 (SD 4.62) years old. Written informed consent was obtained from all participants before enrollment. All study procedures were conducted in accordance with the requirements of the Research Ethics Committee of Siberian State Medical University and the Declaration of Helsinki. The study was reviewed and approved by the Research Ethics Committee of the Siberian State Medical University of the Ministry of Health (Ref. No. 8, January 18, 2023).
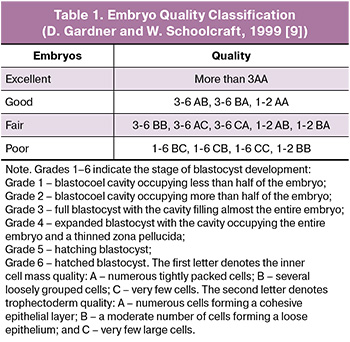
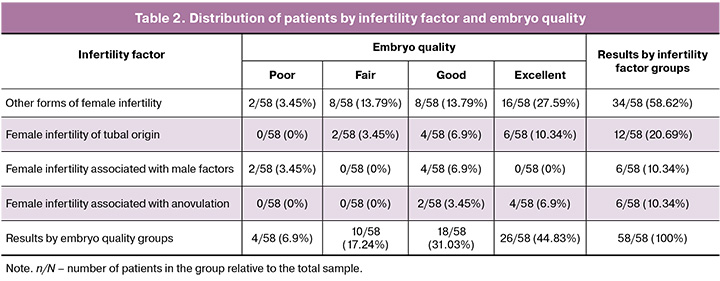
On Day 5 of embryo development, patients were classified into four groups according to embryo quality and morphology based on the criteria proposed by Gardner and Schoolcraft (1999) (Table 1) [9]. Patients were also categorized into four groups according to the underlying cause of infertility based on the International Classification of Diseases, 10th Revision (ICD-10): Group 1, male factor infertility (N97.4); Group 2, tubal infertility (N97.1); Group 3, female infertility associated with anovulation (N97.0); and Group 4, other specified female infertility (N97.8, n=34). The distribution of patients across the groups is shown in Table 2. Peripheral blood samples were collected from all the participants.
Isolation of mononuclear cells
Venous blood (12 mL) was collected from each participant into K3-ethylenediaminetetraacetic acid (K3-EDTA) Vacutainer tubes (Guangzhou Improve Medical Instruments Co., Ltd., China) in the morning after an overnight fast and before the ovarian follicle aspiration. Blood was diluted 1:2 with a washing medium containing RPMI-1640 (PanEco, Russia). Eighteen milliliters of the diluted blood suspension was carefully layered over 9 mL of Ficoll (density 1.077 g/cm³; PanEco, Russia) and centrifuged at 1,500 rpm for 30 min at 24°C. The peripheral blood mononuclear cell (PBMC) layer at the plasma–Ficoll interface was carefully collected into 15-mL tubes (Falcon, Biologix, China) and diluted to the final volume using RPMI-1640 medium. The cells were then washed twice with the washing medium by centrifugation at 1,000 rpm for 12 min at 24°C. Following the final wash, PBMCs were resuspended at a concentration of 2×10⁶ cells/mL in complete culture medium consisting of Dulbecco's Modified Eagle Medium (DMEM) supplemented with L-glutamine, penicillin, streptomycin, and 10% heat-inactivated fetal bovine serum (PanEco, Russia).
Induction of peripheral blood monocytes into macrophages
Freshly isolated PBMCs (2×10⁶ cells in 1 mL of complete culture medium) were seeded into individual wells of 24-well flat-bottom tissue culture plates (TPP, Switzerland). Three experimental conditions were established for each sample: (1) cell culture control, (2) induction of M1 macrophages, and (3) induction of M2 macrophages, as previously described. Macrophage colony-stimulating factor (M-CSF) was added to all wells at a final concentration of 20 ng/mL. After 5 days of incubation in a humidified atmosphere containing 5% CO2, lipopolysaccharide (LPS; Sigma, USA) was added to the second condition at a final concentration of 100 ng/mL to induce M1 macrophage polarization, and interleukin-4 (IL-4; Sigma, USA) was added to the third condition at a final concentration of 10 ng/mL to induce M2 macrophage polarization. After an additional 24 h of incubation, non-adherent cells were removed by washing. Adherent macrophages were detached from the culture surface using a cell scraper, transferred into 1.5-mL microcentrifuge tubes (Ningbo Greetmed Medical Instruments Co., Ltd., China) containing complete culture medium, and stained for phenotypic analysis.
Assessment of macrophage phenotypic marker expression
Aliquots of patient-derived cell cultures (100–200 μL) were washed twice with phosphate-buffered saline (PBS; Amresco, USA) by centrifugation at 2,000 rpm (Thermo Scientific, USA) for 5 min. For M1 macrophage identification, the samples were incubated with anti-human CD68 fluorescein isothiocyanate (FITC)-conjugated antibody (AssayVector, China), anti-human HLA-DR phycoerythrin (PE)-conjugated antibody (Elabscience, China), and anti-human CD80 allophycocyanin (APC)-conjugated antibody (Elabscience, China) (5 μL of each antibody) for 20 min at room temperature in the dark. For M2 macrophage identification, samples were incubated under identical conditions with FITC-conjugated anti-human CD68 antibody (AssayVector, China), PE-conjugated anti-human CD163 antibody (BioLegend, USA), and APC-conjugated anti-human CD206/MMR antibody (Elabscience, USA). Following incubation, the samples were washed once with PBS by centrifugation at 2,000 rpm for 5 min. After washing, the samples were gently resuspended and analyzed using a CytoFLEX flow cytometer (Beckman Coulter, CA, USA). Macrophage phenotypes were identified using the appropriate control samples. The following controls were used:
- The unstained control contained none of the three fluorochrome-conjugated antibodies.
- Single-stained controls consisted of samples containing only one of the three fluorochrome-conjugated antibodies.
- Double-stained controls consisted of samples containing combinations of two of the three fluorochrome-conjugated antibodies (CD68-FITC and CD163-PE, CD68-FITC and CD206-APC, or CD163-PE and CD206-APC for M2 macrophage detection; CD68-FITC and HLA-DR-PE, CD68-FITC and CD80-APC, or HLA-DR-PE and CD80-APC for M1 macrophage detection).
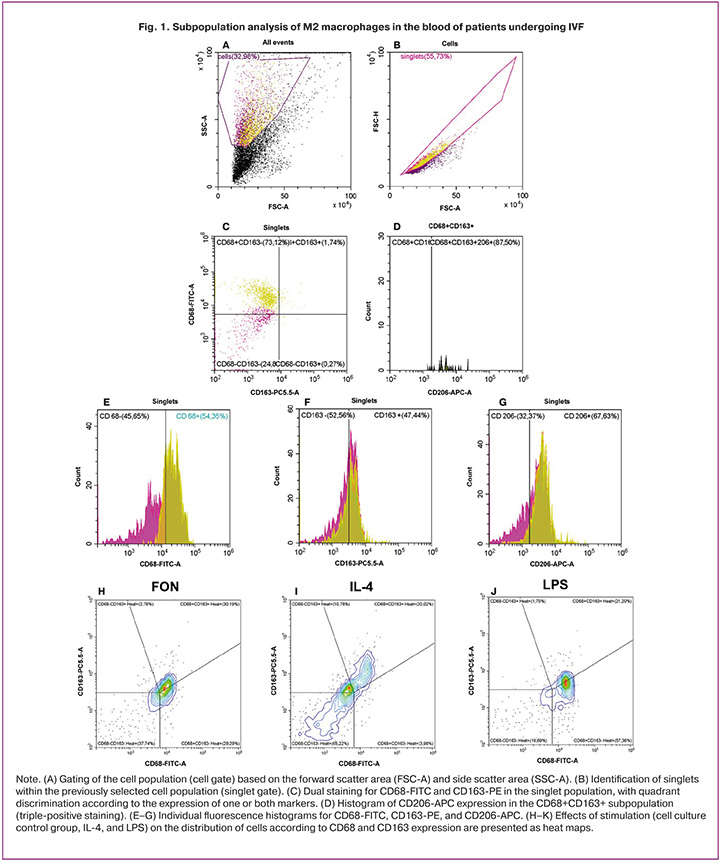
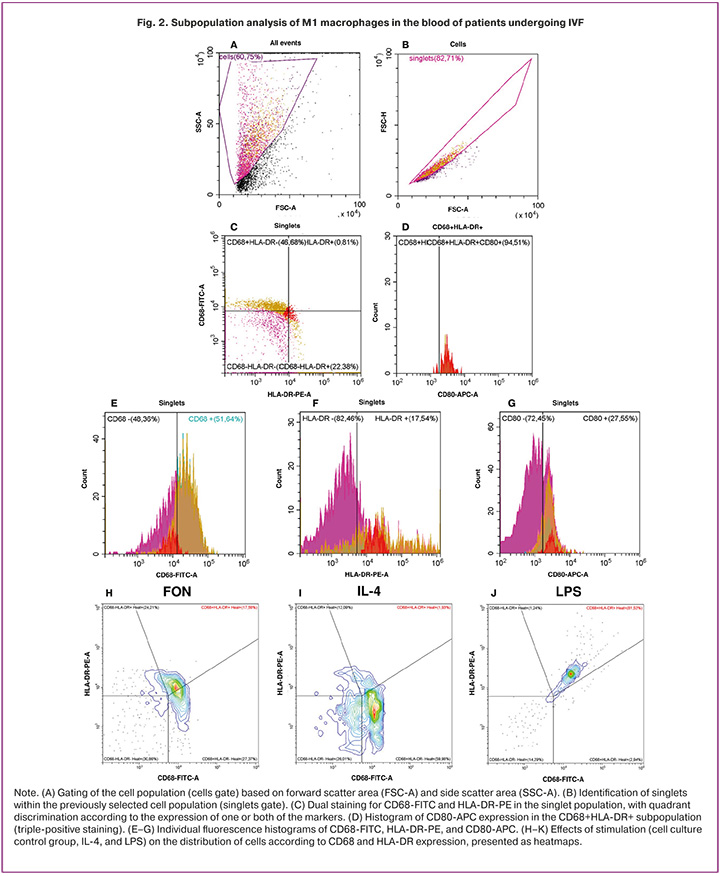
The fluorescence intensity threshold (positivity cutoff) for each detection channel was established according to the upper limit of the fluorescence intensity histogram obtained from the corresponding, single-stained control. Fluorescence spillover compensation was performed by comparing the unstained controls with the single-stained controls. Unstained controls were used as reference samples to determine the background fluorescence. Representative gating strategies for the M2 and M1 macrophage populations are shown in Figures 1 and 2, respectively.
Enzyme-linked immunosorbent assay
Tumor necrosis factor alpha (TNF-α) concentrations were determined using a solid-phase enzyme-linked immunosorbent assay (ELISA) with a commercially available kit (Vector-Best JSC, Russia).
The samples were incubated in microplate wells pre-coated with anti-TNF-α antibodies, followed by the sequential addition of an enzyme-conjugated reagent and substrate, resulting in the formation of a colored reaction product. Optical density was measured at 450 nm wavelength. Quantitative determination was performed using a calibration curve generated from the standards provided by the kit. All procedures were performed according to the manufacturer's instructions.
TNF-α concentrations were measured in the cell culture supernatants and expressed as pg/mL. Before culture initiation, the concentration of peripheral blood mononuclear cells was standardized to 2×10⁶ cells/mL for all samples. No additional normalization of TNF-α concentrations to the post-culture cell count was performed in this study.
Statistical analysis
Statistical analyses were performed using Statistica version 12.0 (TIBCO Software Inc., USA), IBM SPSS Statistics version 28.0.1.0 (IBM Corp., USA), and R version 4.3.0 in the RStudio integrated development environment with specialized packages. The initial stage of the analysis involved assessing the distribution of continuous variables for normality using the Lilliefors-corrected Kolmogorov–Smirnov test. Normality was not confirmed for the primary immunological variables (macrophage subpopulation proportions and TNF-α concentrations); therefore, non-parametric statistical methods were used for group comparisons. In contrast, patient age was approximately normally distributed. Data are presented as median (Me) and interquartile range (Q1–Q3), whereas age is reported as mean (SD). Comparisons among three or more groups were performed using the Kruskal–Wallis test with a significance level of p<0.05. Pairwise comparisons between groups were conducted using the Mann–Whitney U test with Bonferroni correction. After Bonferroni adjustment, the significance threshold was set at p<0.0083 for comparisons according to embryo quality and infertility etiology, and at p<0.0167 for comparisons among stimulation groups. The associations between continuous variables were assessed using Spearman's rank correlation coefficient. The correlation strength was interpreted according to the Chaddock scale.
Results
The distribution of patients according to infertility factor and embryo quality is presented in Table 2. Four patients were assigned to the poor embryo quality group, 10 to the fair-quality group, 18 to the good-quality group, and 26 to the excellent-quality group. Patients were also stratified into four groups according to the specific infertility factor per ICD-10.
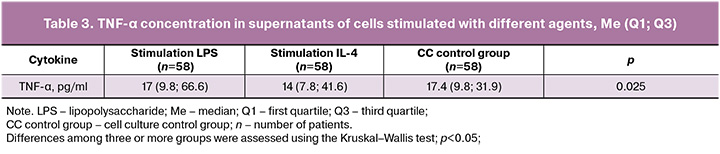
The concentrations of TNF-α in the supernatants of cells stimulated with different agents are presented in Table 3. The median TNF-α production in the LPS-stimulated group – 17 (9.8; 66.6) pg/mL – was comparable to that in the cell culture control group – 17.4 (9.8; 31.9) pg/mL – whereas IL-4 stimulation was associated with a substantially lower median value of 14 (7.8; 41.6) pg/mL. The between-group difference was statistically significant (p=0.025).
Analysis of the distribution of macrophage subsets expressing CD68, HLA-DR, and CD80, and CD68, CD163, and CD206 across infertility factors and stimulation conditions revealed statistically significant differences (Table 4). Under LPS stimulation, the proportion of CD68-HLA-DR+CD80+ cells differed significantly among groups (p = 0.030); the median was highest in male-factor infertility –79.8% (65.3; 88.7) and lower in the other groups: anovulatory infertility – 78.3% (60.5; 90.9); tubal factor – 66.1% (60.8; 84.4); and other forms – 64% (49.6; 82.3). For CD68+HLA-DR-CD80+ cells the difference (p=0.020) reflected the highest median in anovulatory infertility – 65.4% (34.1; 67.5) compared with 33.89% (24; 43.4) in male-factor, 26.8% (19.2; 29.9) in tubal-factor, and 33.7% (16.3; 53.8) in other forms of infertility.
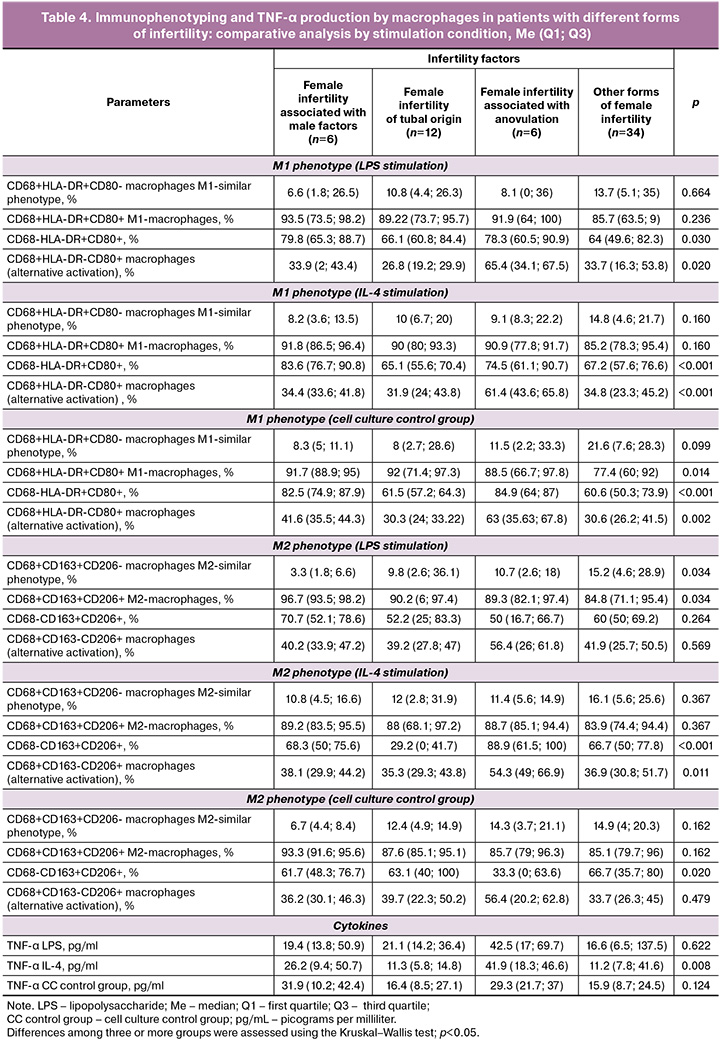
Under IL-4 stimulation, significant differences were likewise observed for CD68-HLA-DR+CD80+ cells (p<0.001), with median values of 83.6% (76.74; 90.8) in male-factor infertility, 65.1% (55.6; 70.4) in tubal-factor infertility, 74.5% (61.1; 90.7) in anovulatory infertility, and 67.2% (57.6; 76.6) in other forms of infertility. The alternatively activated CD68+HLA-DR-CD80+ macrophage phenotype also differed significantly under IL-4 stimulation (p<0.001), with the highest median observed in patients with anovulatory infertility – 61.4% (43.6; 65.8) and lower values in the other infertility categories: male factor – 34.4% (33.6; 41.8); tubal factor – 31.9% (24; 43.8); and other forms – 34.8% (23.3; 45.2).
In unstimulated cell cultures, differences were likewise observed in macrophage distribution. For the CD68+HLA-DR+CD80+ (M1) phenotype (p=0.014), medians were higher in tubal-factor – 92% (71.4; 97.3) and male-factor infertility – 91.7% (88.9; 95), and lower in anovulatory infertility – 88.5% (66.7; 97.8) and other forms –77.4% (60; 92). For CD68-HLA-DR+CD80+ cells (p<0.001), the highest values were observed in male-factor – 82.5% (74.9; 87.9) and anovulatory infertility –84.9% (64; 87) with the lowest values in tubal-factor – 61.5% (57.2; 64.3) and other forms – 60.6% (50.3; 73.9). For CD68+HLA-DR-CD80+ cells (p=0.002), the highest median occurred in anovulatory infertility – 63% (35.6; 67.8) compared with 41.6% (35.5; 44.3) in male-factor, 30.3% (24; 33.2) in tubal-factor, and 30.6% (26.2; 41.5) in other forms of infertility.
LPS stimulation revealed statistically significant differences in M2 macrophages of the CD68+CD163+CD206- phenotype (p=0.034). The lowest median was observed in the male-factor group – 3.3% (1.8; 6.6) with a progressive increase across the remaining groups: tubal-factor infertility – 9.8% (2.6; 36.1); anovulatory infertility – 10.71% (2.6; 18); and other forms – 15.2% (4.6; 28.9). Significant differences were likewise found for classical M2 macrophages of the CD68+CD163+CD206+ phenotype (p=0.034), with the highest median observed in male-factor infertility – 96.7% (93.5; 98.2) and the lowest in the group with other forms of infertility – 84.8% (71.1; 95.4).
Analysis of the distribution of M2-polarization–associated macrophage subsets under IL-4 stimulation revealed significant differences for CD68-CD163+CD206+ cells (p<0.001). The highest median was recorded in the anovulatory infertility group – 88.9% (67.6; 100) whereas the median was 29.2% (0; 41.7) in tubal-factor infertility, 68.3% (50; 75.6) in male-factor infertility, and 66.7% (50; 77.8) in other forms of infertility. Statistically significant differences were also found for the alternatively activated CD68+CD163-CD206+ M2 macrophage phenotype (p=0.011). The highest median was observed in anovulatory infertility – 54.3% (49; 66.9) compared with 38.12% (29.9; 44.2) in male-factor infertility and 36.9% (30.8; 51.7) in other forms of infertility, while the lowest value – 35.3% (29.3; 43.8) was observed in patients with tubal-factor infertility (Table 4).
In the cell culture control group, analysis of M2 markers revealed statistically significant differences for cells of the CD68-CD163+CD206+ phenotype (p=0.020). Median values were highest in the group with other forms of infertility – 66.7% (35.7; 80) while the median was 61.7% (48.3; 76.7) in the male-factor group, 63.1% (40; 100) in the tubal-factor group, and 33.3% (0; 63.6) in the anovulatory infertility group.
TNF-α concentrations in IL-4–stimulated cell supernatants also differed significantly between groups (p=0.008). The highest values were observed in anovulatory infertility – 41.9 (18.3; 46.6) pg/mL and in the male-factor infertility group – 26.2 (9.4; 50.7) pg/mL whereas the median was 11.3 (5.8; 14.8) pg/mL in tubal-factor infertility and 11.2 (7.8; 41.6) pg/mL in other forms of infertility.
Analysis of the distribution of macrophage subsets expressing CD68, HLA-DR, and CD80, and CD68, CD163, and CD206 across embryo quality categories and stimulation conditions revealed statistically significant differences (Table 5). Under LPS stimulation, the median proportion of CD68+HLA-DR+CD80- cells (p=0.016) was highest in the poor-quality group – 28.1% (13.7; 42.6) and decreased progressively in the fair-quality – 11.2% (6; 36.5), good-quality – 18.5% (10.5; 26.3) and excellent-quality – 6% (4.4; 20) groups. For M1 macrophages CD68+HLA-DR+CD80+ (p=0.001) the lowest value was observed in the poor-quality group –71.9% (57.5; 86.3) whereas values in the fair- and good-quality groups were 88.8% (63.5; 94) and 78.7% (64; 85.7), respectively, reaching 94% (80; 95.7) in the excellent-quality group. For CD68+HLA-DR-CD80+ cells (p=0.036), the median was higher in the fair-quality group –37.8% (29.6; 53.8) than in the poor-quality –32.9% (14.2; 51.6), good-quality – 27.6% (12.9; 33.9) and excellent-quality – 30.4% (19.2; 60.6) embryo groups.
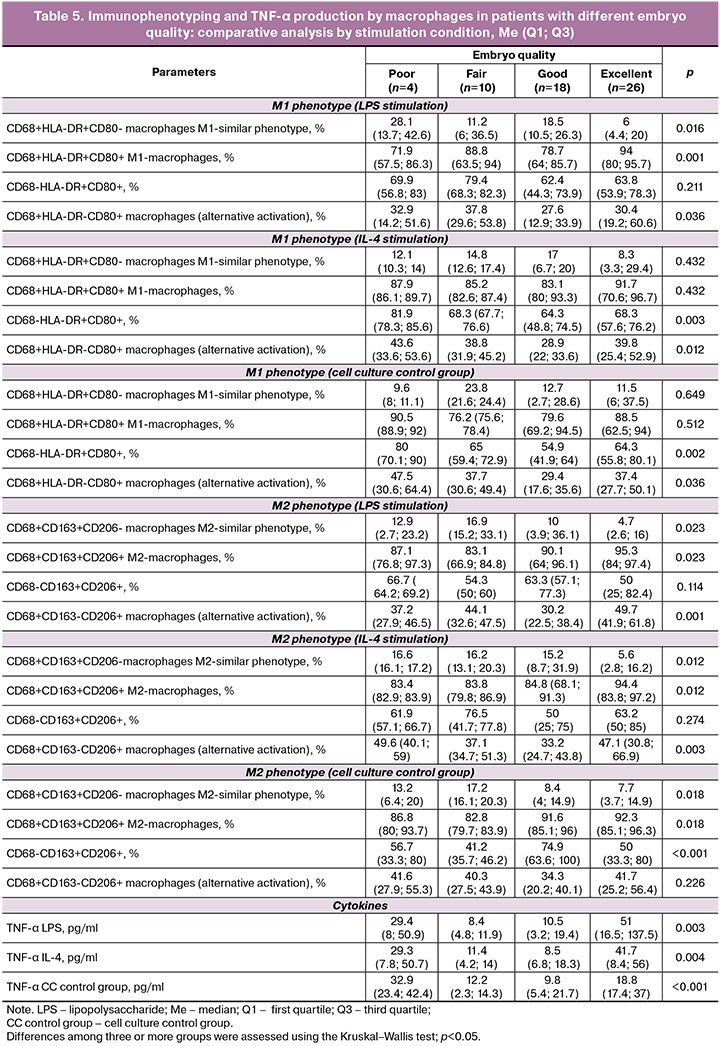
The CD68-HLA-DR+CD80+ phenotype under IL-4 stimulation showed statistically significant between-group differences (p=0.003). The highest median was observed in the poor embryo quality group – 81.9% (78.3; 85.6) followed by the excellent-quality – 68.3% (57.6; 76.2) and fair-quality – 68.3% (67.7; 76.6) groups, with the lowest value recorded in the good-quality group – 64.3% (48.8; 74.5). Differences were also significant for CD68+HLA-DR-CD80+ cells, a marker of alternative macrophage activation (p=0.012). The highest median was observed in the poor embryo quality group – 43.6% (33.6; 53.6) while values in the fair- and excellent-quality groups were comparable – 38.8% (31.9; 45.2) and 39.8% (25.4; 52.9), respectively, and the lowest median was observed in the good-quality group – 28.93% (22; 33.6).
In the cell culture control group, statistically significant differences were observed for CD68-HLA-DR+CD80+ cells (p=0.002). The highest median was observed in the poor embryo quality group – 80% (70.1; 90) followed by the fair-quality – 65% (59.43; 72.9) and excellent-quality – 64.34% (55.8; 80.1) groups, with the lowest value recorded in the good-quality group – 54.93% (41.9; 64). Significant differences were also found for the CD68+HLA-DR-CD80+ phenotype (alternative activation; p=0.036). The highest median was observed in the poor-quality group –47.5% (30.6; 64.4) followed by the fair-quality – 37.7% (30.6; 49.4) and excellent-quality – 37.4% (27.7; 50.1) groups, with the lowest value in the good-quality group – 29.4% (17.6; 35.6).
Analysis of the distribution of CD68+CD163+CD206- macrophages (M2-like phenotype) under LPS stimulation revealed statistically significant between-group differences (p=0.023). The highest median was observed in the fair embryo quality group – 16.9% (15.2; 33.1) compared with 12.9% (2.7; 23.2) in the poor-quality group and 10% (3.9; 36.1) in the good-quality group, with the lowest value in the excellent-quality group – 4.7% (2.6; 16). Significant differences were also observed for classical M2 macrophages (CD68+CD163+CD206+; p=0.023). The lowest median was recorded in the fair-quality group – 83.1% (66.9; 84.8) with values of 87.1% (76.8; 97.3) in the poor-quality group and 90.1% (64; 96.1) in the good-quality group, and the highest value in the excellent-quality group – 95.3% (84; 97.4). The CD68+CD163-CD206+ phenotype, reflecting alternative macrophage activation, likewise showed a highly significant difference (p<0.001). The highest median was observed in the excellent embryo quality group – 49.7% (41.9; 61.8) compared with 44.1% (32.6; 47.5) in the fair-quality group and 37.2% (27.9; 46.5) in the poor-quality group, with the lowest value in the good-quality group – 30.2% (22.5; 38.4).
Analysis of the distribution of CD68+CD163+CD206- macrophages (M2-like phenotype) under IL-4 stimulation revealed statistically significant between-group differences (p=0.012). The highest median was observed in the poor embryo quality group – 16.6% (16.1; 17.2) with medians of 16.2% (13.1; 20.3) and 15.2% (8.7; 31.9) in the fair- and good-quality groups, respectively, and the lowest value in the excellent-quality group – 5.6% (2.8; 16.2). Significant differences were also observed for the CD68+CD163+CD206+ phenotype (classical M2 macrophages; p=0.012). The lowest median was recorded in the poor-quality group – 83.4% (82.9; 83.9) while the highest value was observed in the excellent embryo quality group –94.4% (83.8; 97.2) with values of 83.8% (79.8; 86.9) and 84.8% (68.1; 91.3) in the fair- and good-quality groups, respectively. Alternatively activated CD68+CD163-CD206+ macrophages likewise showed a statistically significant between-group difference (p=0.003). The median value was highest in the poor embryo quality group – 49.6% (40.1; 59) decreasing in the fair-quality – 37.1% (34.7; 51.32) and good-quality – 33.2% (24.7; 43.8) groups, and rising again in the excellent-quality group – 47.1% (30.8; 66.9).
Analysis of the distribution of CD68+CD163+CD206- macrophages (M2-like phenotype) in the cell culture control group revealed statistically significant between-group differences (p=0.018). The highest median was observed in the fair embryo quality group – 17.2% (16.1; 20.3) with 13.2% (6.4; 20) in the poor-quality group and 8.4% (4.00; 14.9) in the good-quality group, and the lowest value in the excellent-quality group – 7.7% (3.7; 14.9). Statistically significant differences were also found for the CD68+CD163+CD206+ phenotype (classical M2 macrophages; p=0.018). The highest median was observed in the excellent embryo quality group – 92.3% (85.1; 96.3) compared with 86.8% (80; 93.7) and 82.8% (79.7; 83.9) in the poor- and fair-quality groups, respectively, and 91.6% (85.1; 96) in the good-quality group. The CD68-CD163+CD206+ phenotype showed the most pronounced statistical difference among the M2 subgroups in the control group (p<0.001). The highest median was observed in the good embryo quality group – 74.9% (63.6; 100) and 50% (33.3; 80) in the excellent-quality group, compared with 56.7% (33.3; 80) and 41.2% (35.7; 46.2) in the poor- and fair-quality groups, respectively.
Analysis of TNF-α concentrations in LPS-stimulated cell supernatants revealed statistically significant differences among the embryo-quality groups (p=0.003). The highest median was observed in the excellent-quality group – 51.01 (16.5; 137.5) pg/mL compared with 29.44 (8; 50.9), 8.4 (4.82; 11.9), and 10.5 (3.2; 19.4) pg/mL in the poor-, fair-, and good-quality groups, respectively. TNF-α concentrations under IL-4 stimulation also differed significantly between groups (p=0.004). The highest value was recorded in the excellent embryo quality group – 41.73 (8.4; 56) pg/mL with the lowest medians in the fair- and good-quality groups – 11.4 (4.2; 14) and 8.5 (6.8; 18.3) pg/mL, respectively. In the poor-quality group, the median was 29.3 (7.8; 50.7) pg/mL. In the absence of stimulation (cell culture control group), statistically significant differences were likewise observed (p<0.001). The median reached 18.83 (17.4; 37) pg/mL in the excellent-quality group, 32.9 (23.4; 42.4) pg/mL in the poor-quality group, 12.2 (2.3; 14.3) pg/mL in the fair-quality group, and 9.8 (5.4; 21.7) pg/mL in the good-quality group.

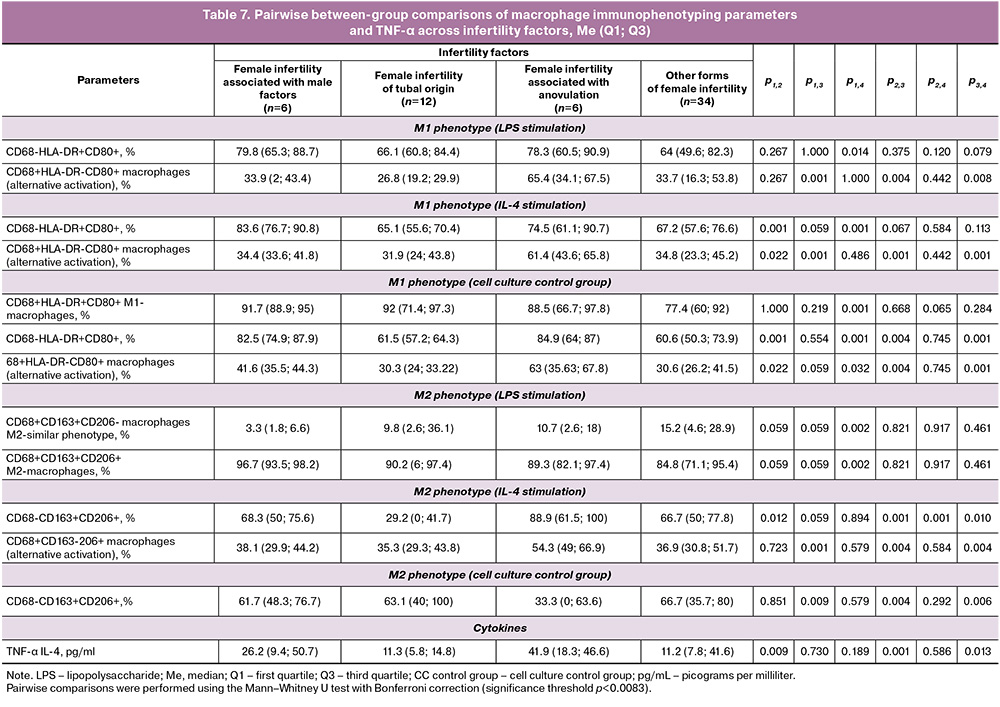
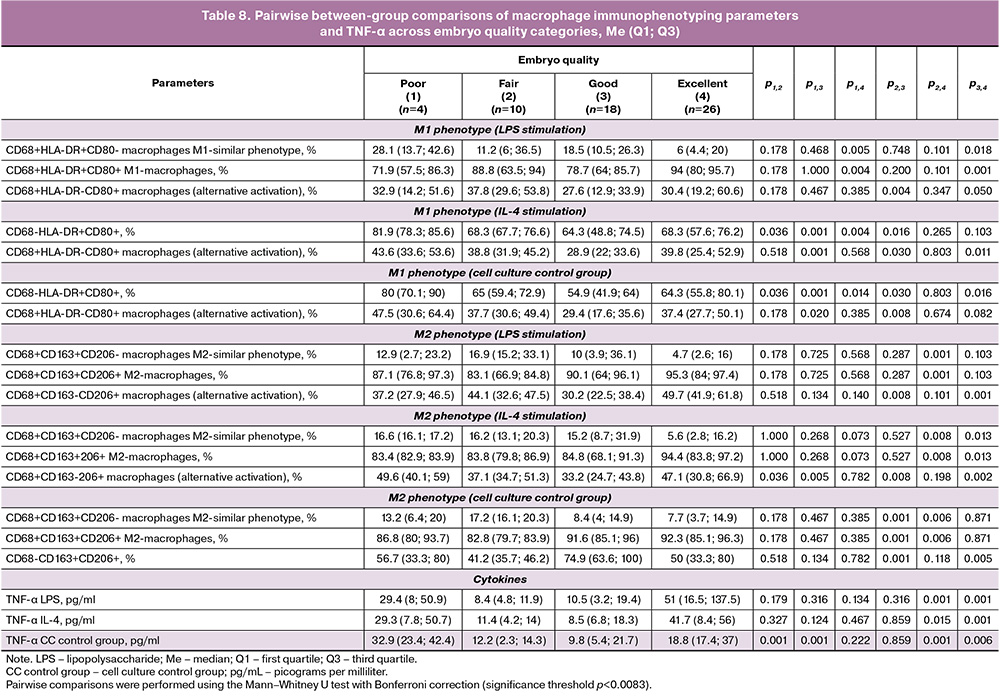
Based on the results presented in Tables 3, 4, and 5, statistically significant parameters were selected for post hoc analysis. After applying the relevant correction, the significance threshold was set at p<0.0167 for Table 6 and p<0.0083 for Tables 7 and 8.
According to Table 6, pairwise comparison of TNF-α concentrations in cell supernatants revealed a statistically significant difference only between the LPS-stimulated (17 [9.8; 66.6]) and IL-4-stimulated (14 [7.8; 41.6]) groups (p=0.006), with a higher median TNF-α concentration under LPS stimulation – 17 (9.83; 66.56) pg/mL than under IL-4 stimulation – 14.0 (7.76; 41.6) pg/mL.
Table 7 presents the results of pairwise comparisons of median macrophage subpopulation proportions and TNF-α concentrations among four patient groups stratified by infertility factor: group 1 – male factor; group 2 – tubal factor; group 3 – anovulation; group 4 – other forms of female infertility. Pairwise comparisons were performed with Bonferroni correction (critical significance threshold p<0.0083).
For the M1 phenotype under LPS stimulation, statistically significant differences were found in the proportion of CD68+HLA-DR-CD80+ macrophages (alternative activation) between the following pairs: group 1 – 33.9% (2; 43.4) versus group 3 –65.4% (34.1; 67.5) (p=0.001); group 2 – 26.8% (19.2; 29.9) versus group 3 – 65.4% (34.1; 67.5) (p=0.004); and group 3 – 65.4% (34.1; 67.5) versus group 4 – 33.7% (16.3; 53.8) (p=0.008).
For the M1 phenotype under IL-4 stimulation, statistically significant between-group differences were observed for two phenotypes. The first, CD68-HLA-DR+CD80+, showed significant differences between the following pairs: groups 1 and 2 – 83.6% (76.7; 90.8) versus 65.1% (55.6; 70.4) (p=0.001) and groups 1 and 4 – 83.6% (76.7; 90.8) versus 67.2% (57.6; 76.6) (p=0.001). The second phenotype, CD68+HLA-DR-CD80+ (alternative activation), showed significant differences between groups 1 and 3 – 34.4% (33.6; 41.8) versus 61.4% (43.6; 65.8) (p=0.001), groups 2 and 3 – 31.9% (24; 43.8) versus 61.4% (43.6; 65.8) (p=0.001) and groups 3 and 4 – 61.4% (43.6; 65.8) versus 34.8% (23.3; 45.2) (p=0.001).
In the cell culture control group, for the unstimulated M1 phenotype, statistically significant differences were found for CD68+HLA-DR+CD80+ M1 macrophages between groups 1 and 4 – 91.7% (88.9; 95) versus 77.4% (60; 92) (p=0.001); for the CD68-HLA-DR+CD80+ phenotype between groups 1 and 2 – 82.5% (74.9; 87.9) versus 61.5% (57.2; 64.3) (p 0.001), groups 1 and 4 – 82.5% (74.9; 87.9) versus 60.6% (50.3; 73.9) (p=0.001), groups 2 and 3 – 61.5% (57.2; 64.3) versus 84.9% (64; 87) (p=0.004) and groups 3 and 4 – 84.9% (64; 87) versus 60.6% (50.3; 73.9) (p=0.001); and for the CD68+HLA-DR-CD80+ phenotype (alternative activation) between groups 2 and 3 – 30.3% (24; 33.22) versus 63% (35.63; 67.8) (p=0.004) and groups 3 and 4 – 63% (35.63; 67.8) versus 30.6% (26.2; 41.5) (p=0.001).
For the M2 phenotype under LPS stimulation, statistically significant differences were found in the proportions of CD68+CD163+CD206- M2-like macrophages and CD68+CD163+CD206+ M2 macrophages between group 1 – 3.3% (1.8; 6.6) and group 4 – 15.2% (4.6; 28.9) (p=0.002) and between group 1 – 96.7% (93.5; 98.2) and group 4 – 84.8% (71.1; 95.4) (p=0.002), respectively.
For the M2 phenotype under IL-4 stimulation, significant differences were observed for the CD68-CD163+CD206+ phenotype between groups 2 and 3 – 29.2% (0; 41.7) versus 88.9% (61.5; 100) (p=0.001) and groups 2 and 4 – 29.2% (0; 41.7) versus 66.7% (50; 77.8) (p=0.001) as well as for the CD68+CD163-CD206+ phenotype (alternative activation) between group 1 – 38.1% (29.9; 44.2) and group 3 – 54.3% (49; 66.9) (p=0.001), group 2 – 35.3% (29.3; 43.8) and group 3 – 54.3% (49; 66.9) (p=0.004), and group 3 – 54.3% (49; 66.9) versus group 4 – 36.9% (30.8; 51.7) (p=0.004).
In the cell culture control group, for the unstimulated M2 phenotype, statistically significant differences in CD68-CD163+CD206+ macrophages were observed between groups 2 and 3 – 63.1% (40; 100) versus 33.3% (0; 63.6) (p=0.004) and groups 3 and 4 – 33.3% (0; 63.6) versus 66.7% (35.7; 80) (p=0.006).
For TNF-α (IL-4 stimulation), significant differences were recorded between groups 2 and 3 – 11.3 (5.8; 14.8) pg/mL versus 41.9 (18.3; 46.6) pg/mL (p=0.001).
Table 8 presents the results of pairwise comparisons of median macrophage subpopulation proportions and TNF-α concentrations among four patient groups stratified by day-5 embryo quality (1, poor; 2, fair; 3, good; 4, excellent). Pairwise comparisons were performed with Bonferroni correction (p<0.0083).
For CD68+HLA-DR+CD80- macrophages of the M1-like phenotype, a significant difference was observed between groups 1 and 4: the median was 28.1% (13.7; 42.6) in the poor embryo quality group versus 6.0% (4.4; 20.0) in the excellent-quality group (p=0.005). For CD68+HLA-DR+CD80+ M1 macrophages, significant differences were found between groups 1 and 4 – 71.9% (57.5; 86.3) versus 94.0% (80.0; 95.7) (p=0.004) and between groups 3 and 4 – 78.7% (64.0; 85.7) versus 94.0% (80.0; 95.7) (p=0.001). For the CD68+HLA-DR-CD80+ phenotype (alternative activation), a statistically significant difference was observed between groups 2 and 3 – 37.8% (29.6; 53.8) versus 27.6% (12.9; 33.9) (p=0.004).
Analysis of the M1 phenotype under IL-4 stimulation revealed statistically significant differences for two phenotypes. For CD68-HLA-DR+CD80+, significant differences were found between groups 1 and 3 – 81.9% (78.3; 85.6) versus 64.3% (48.8; 74.5) (p=0.001) and between groups 1 and 4 – 81.9% (78.3; 85.6) versus 68.3% (57.6; 76.2) (p=0.004). For the CD68+HLA-DR-CD80+ phenotype (alternative activation), a significant difference was observed between groups 1 and 3 – 43.6% (33.6; 53.6) versus 28.9% (22.0; 33.6) (p=0.001).
In the cell culture control group, for the unstimulated M1 phenotype, statistically significant differences were found for CD68-HLA-DR+CD80+ between groups 1 and 3 – 80.0% (70.1; 90.0) versus 54.9% (41.9; 64.0) (p=0.001). For the CD68+HLA-DR-CD80+ phenotype (alternative activation), a significant difference was observed between groups 2 and 3 – 37.7% (30.6; 49.4) versus 29.4% (17.6; 35.6) (p=0.008).
For the M2 phenotype under LPS stimulation, statistically significant differences were found in the proportions of CD68+CD163+CD206- M2-like macrophages and CD68+CD163+CD206+ M2 macrophages between groups 2 and 4. For CD68+CD163+CD206-, the medians were 16.9% (15.2; 33.1) and 4.7% (2.6; 16.0), respectively (p=0.001), and for CD68+CD163+CD206+, 83.1% (66.9; 84.8) and 95.3% (84.0; 97.4), respectively (p=0.001). For CD68+CD163-CD206+ macrophages (alternative activation), statistically significant differences were observed between groups 2 and 3 – 44.1% (32.6; 47.5) versus 30.2% (22.5; 38.4) (p=0.008) and between groups 3 and 4 – 30.2% (22.5; 38.4) versus 49.7% (41.9; 61.8) (p=0.001).
Analysis of the M2 phenotype under IL-4 stimulation revealed significant differences for several phenotypes. For CD68+CD163+CD206- M2-like macrophages, a statistically significant difference was observed between groups 2 and 4 – 16.2% (13.1; 20.3) versus 5.6% (2.8; 16.2) (p=0.008). A similar difference was found for CD68+CD163+CD206+ M2 macrophages between the same groups: 83.8% (79.8; 86.9) versus 94.4% (83.8; 97.2) (p=0.008). For the CD68+CD163-CD206+ phenotype (alternative activation), significant differences were found between groups 1 and 3 – 49.6% (40.1; 59.0) versus 33.2% (24.7; 43.8) (p=0.005), groups 2 and 3 – 37.1% (34.7; 51.3) versus 33.2% (24.7; 43.8) (p=0.008) and groups 3 and 4 – 33.2% (24.7; 43.8) versus 47.1% (30.8; 66.9) (p=0.002).
In the cell culture control group, for the unstimulated M2 phenotype, statistically significant differences were found for CD68+CD163+CD206- M2-like macrophages between groups 2 and 3 – 17.2% (16.1; 20.3) versus 8.4% (4.0; 14.9) (p=0.001), and groups 2 and 4 – 17.2% (16.1; 20.3) versus 7.7% (3.7; 14.9) (p=0.006). For CD68+CD163+CD206+ M2 macrophages, significant differences were likewise found between groups 2 and 3 – 82.8% (79.7; 83.9) versus 91.6% (85.1; 96.0) (p=0.001), and groups 2 and 4 – 82.8% (79.7; 83.9) versus 92.3% (85.1; 96.3) (p=0.006). For the CD68-CD163+CD206+ phenotype, statistically significant differences were recorded between groups 2 and 3 – 41.2% (35.7; 46.2) versus 74.9% (63.6; 100.0) (p=0.001), and between groups 3 and 4 – 74.9% (63.6; 100.0) versus 50.0% (33.3; 80.0) (p=0.005).
Statistically significant differences in TNF-α were found under LPS stimulation between groups 2 and 4 – 8.4 (4.8; 11.9) pg/mL versus 51.0 (16.5; 137.5) pg/mL (p=0.001), and between groups 3 and 4 – 10.5 (3.2; 19.4) pg/mL versus 51.0 (16.5; 137.5) pg/mL (p=0.001). Under IL-4 stimulation, a statistically significant difference was observed between groups 3 and 4 – 8.5 (6.8; 18.3) pg/mL versus 41.7 (8.4; 56.0) pg/mL (p=0.001). In the cell culture control group, significant differences were found between groups 1 and 2 – 32.9 (23.4; 42.4) pg/mL versus 12.2 (2.3; 14.3) pg/mL (p=0.001), groups 1 and 3 – 32.9 (23.4; 42.4) pg/mL versus 9.8 (5.4; 21.7) pg/mL (p=0.001), groups 2 and 4 – 12.2 (2.3; 14.3) pg/mL versus 18.8 (17.4; 37.0) pg/mL (p=0.001) and groups 3 and 4 – 9.8 (5.4; 21.7) pg/mL versus 18.8 (17.4; 37.0) pg/mL (p=0.006).
Correlation analysis was used to construct a correlation heat map for the four infertility factors, shown in Figure 3. In the group with male-factor infertility, markers showed exceptionally strong correlations. All subtypes of CD68+HLA-DR+CD80+ and CD68+HLA-DR+CD80- macrophages induced by LPS, IL-4, and in the unstimulated control group were positively correlated with one another, with coefficients approaching r≈1.000 (p≤0.001). The same pattern was observed for the CD68+CD163+CD206+ and CD68+CD163+CD206- pairs across conditions, including the control, LPS, and IL-4 (r≈1.000, p≤0.001). Strong negative correlations, approaching r=-1.000 (p≤0.001), were observed between classical M1 and classical M2 macrophages. Alternatively, activated CD68+CD163-CD206+ M2 macrophages were positively correlated with CD68+CD163+CD206+ macrophages (LPS and IL-4 conditions), r≈1.000, p≤0.001. Alternatively, activated CD68+HLA-DR-CD80+ M1 macrophages (LPS) showed a near-complete negative correlation with CD206+ macrophages in the cell culture control group, r≈-1.000, p≤0.001. TNF-α (LPS) was positively correlated with the number of CD68+HLA-DR+CD80+ macrophages (LPS) (r≈0.670, p≤0.001) and negatively correlated with the number of CD68+CD163+CD206+ macrophages (IL-4) (r≈-0.650, p≤0.001).
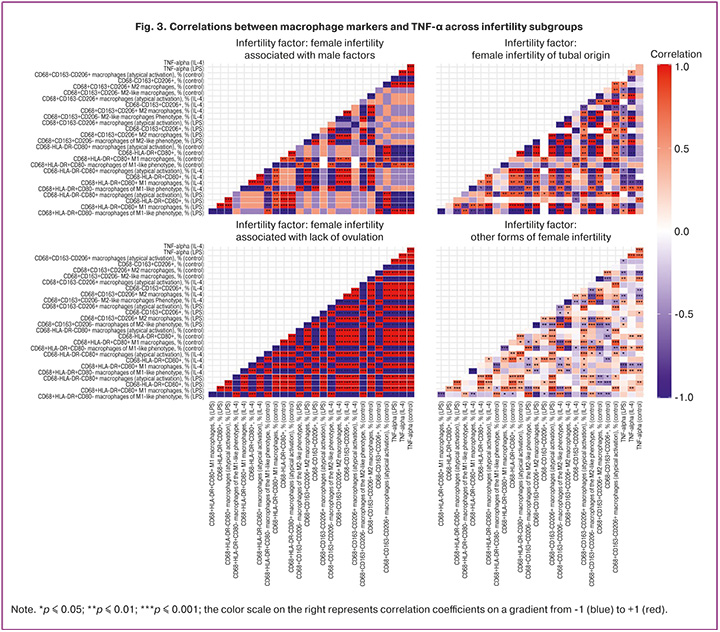
In the group with tubal-factor infertility, exceptionally strong positive correlations were observed between CD68+HLA-DR+CD80+ and CD68+HLA-DR+CD80- macrophages across all conditions (LPS, IL-4, and the cell culture control group), r≈1.000, p≤0.001. Pronounced positive correlations were also observed between CD68+CD163+CD206+ and CD206- macrophages (cell culture control group and IL-4 conditions), r≈1.000, p≤0.001. Negative correlations were found between classical M1 and M2 markers – CD68+HLA-DR+CD80+ and CD68+CD163+CD206+ (cell culture control group, IL-4), r≈-1.000, p≤0.001. Alternatively, activated CD68+HLA-DR-CD80+ M1 macrophages (cell culture control group) were positively associated with CD68+HLA-DR+CD80+ macrophages (cell culture control group), r≈1.000, p≤0.001. CD68+HLA-DR+CD80+ macrophages (IL-4) also showed a pronounced negative correlation with CD68+CD163-CD206+ macrophages (IL-4), r≈-1.000, p≤0.001. TNF-α (control groups) was positively correlated with the number of CD68+HLA-DR+CD80+ macrophages (control groups) (r≈0.700, p≤0.001) and negatively correlated with the number of CD68+CD163+CD206+ macrophages (control groups) (r≈-0.680, p≤0.001).
Among the other forms of infertility, M1 macrophages across conditions –particularly LPS and IL-4 – showed consistent positive correlations between CD80+ and CD80- cells (moderately saturated red, r≈0.600–0.700). Similar within-group associations were observed for the M2 subtypes (CD206+ and CD206-). Moderate negative correlations (purple-blue cells) were found between markers of inflammatory M1 and regulatory M2 macrophages, particularly when comparing CD68+HLA-DR+CD80+ and CD68+CD163+CD206+ under IL-4 stimulation and in the cell culture control group condition (r≈-0.500 to -0.600). TNF-α (IL-4) was positively correlated with the number of CD68+HLA-DR+CD80+ macrophages (IL-4) (r≈0.660, p≤0.001) and negatively correlated with the number of CD68+CD163+CD206+ macrophages (control groups) (r≈-0.600, p≤0.001).
Correlation analysis stratified by embryo quality yielded the heatmap shown in Figure 4. In the average-quality embryo group, robust positive correlations were observed between CD68+HLA-DR+CD80+ and CD68+HLA-DR+CD80- macrophages across the LPS-, IL-4-, and comparison-condition cultures (r=-1.000, p≤0.001). Comparably strong intragroup correlations were found between CD68+CD163+CD206+ and CD68+CD163+CD206– macrophages under the same three conditions (r≈1.000, p≤0.001). Classical M1 and M2 subtypes showed strong negative correlations, most pronounced under IL-4 and comparison conditions (r≈-1.000, p≤0.001). Alternative M1 macrophages (CD68+HLA-DR–CD80+, comparison condition) correlated negatively with CD206+ macrophages (comparison condition; r≈-1.000), while positive correlations emerged between CD68+HLA-DR–CD80+ and CD68+HLA-DR+CD80+ under IL-4 (r≈0.900). Alternative M2 macrophages (CD68+CD163–CD206+) were positively associated with classical CD68+CD163+CD206+ macrophages under both IL-4 and comparison conditions. Additional strong positive correlations were found between CD68+CD163–CD206+ (alternative M2) and CD68+CD163+CD206– macrophages under IL-4 (r≈0.750, p≤0.001), and between CD68+CD163–CD206+ and CD68+CD163+CD206+ under comparison conditions (r≈0.700, p≤0.001). CD68+HLA-DR–CD80+ correlated positively with CD68+HLA-DR+CD80– under comparison conditions (r≈0.680, p≤0.001) and negatively with CD68+CD163+CD206+ under IL-4 (r≈-0.600, p≤0.001).
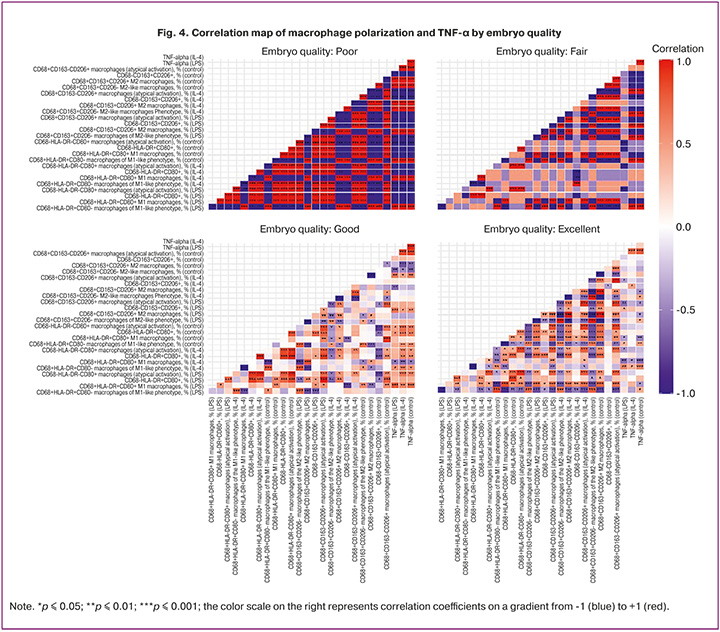
In the good-quality embryo group, the positive intragroup correlation between CD68+HLA-DR+CD80+ and CD80– macrophages remained pronounced (r=1.000, p≤0.001), as did the positive correlation between CD206+ and CD206– macrophages under IL-4 and comparison conditions (r≈0.600, p≤0.001). The negative correlation between CD68+HLA-DR+CD80+ and CD68+CD163+CD206+ macrophages was moderate under both comparison and IL-4 conditions (r≈-0.500, p≤0.001). Among alternative macrophages, CD68+HLA-DR-CD80+ correlated positively with CD68+HLA-DR+CD80+ under LPS (r≈0.650, p≤0.001), and CD68+CD163-CD206+ correlated positively with CD68+CD163+CD206- under IL-4 (r≈0.680, p≤0.001). The negative correlation between CD68+HLA-DR+CD80+ and CD68+CD163+CD206+ macrophages under comparison conditions was further corroborated by their respective relationships with TNF-α levels.
In the excellent-quality embryo group, the positive correlation between CD68+HLA-DR+CD80+ and CD80– macrophages persisted across LPS, IL-4, and comparison conditions, though visually attenuated relative to the lower-quality groups (r=-1.000, p≤0.001). CD206+ and CD206- macrophages followed a similar pattern. The negative association between M1 and M2 subtypes was weaker but remained statistically significant (r≈-0.400 to -0.500, p≤0.001). TNF-α correlated positively with CD68+HLA-DR+CD80+ under comparison conditions (r≈0.600, p≤0.001) and negatively with CD68+CD163+CD206+ under the same conditions (r≈-0.550, p≤0.001).
Discussion
To indirectly assess the cellular response to stimulation, the concentration of tumor necrosis factor-α (TNF-α) was measured in the cell culture supernatants. Pairwise comparisons demonstrated a statistically significant difference only between the lipopolysaccharide (LPS)- and interleukin-4 (IL-4)-stimulated groups: the median TNF-α concentration was 17 pg/mL following LPS stimulation and 14 pg/mL following IL-4 stimulation (p=0.006). No statistically significant differences were observed between the LPS-stimulated and control groups or between the IL-4-stimulated and control groups (p=0.188 and p=0.182, respectively), consistent with previously published findings [10].
Lipopolysaccharide (LPS), a constituent of the outer membrane of gram-negative bacteria, activates Toll-like receptor 4 (TLR4)-mediated signaling, initiating both myeloid differentiation primary response 88 (MyD88)-dependent and Toll/interleukin-1 receptor domain-containing adaptor-inducing interferon-β (TRIF)-dependent pathways. This signaling cascade activates nuclear factor kappa B (NF-κB), promotes macrophage polarization toward the M1 phenotype, and induces the secretion of pro-inflammatory cytokines, including TNF-α, interleukin-1β (IL-1β), and interleukin-6 (IL-6) [11]. Following IL-4 stimulation, which promotes polarization toward the M2 phenotype, the median TNF-α concentration decreased to 14 pg/mL but remained above zero. This finding may indicate the presence of an intermediate macrophage phenotype or mixed M1/M2 activation, as previously reported [12]. Furthermore, the cell culture may have contained other mononuclear cell populations capable of producing TNF-α, which could have also contributed to the measured cytokine concentrations [13]. Interestingly, the TNF-α concentration in the unstimulated samples (17.4 pg/mL) was comparable to that observed following LPS stimulation. This finding may reflect basal immune activation and pre-activation of immunocompetent cells in the study participants, potentially indicating subclinical chronic inflammation, which is frequently associated with reproductive disorders [14].
Particular interest is warranted in the distribution of CD68+CD163−CD206+ macrophages, a phenotype that reflects alternative macrophage activation. These cells are associated with context-dependent immunosuppression and tissue remodeling processes. In particular, CD206+ macrophages produce interleukin-10 (IL-10) and transforming growth factor-β (TGF-β), thereby contributing to the suppression of inflammatory responses and repair of damaged tissues [15]. Under LPS stimulation, the median proportion of CD68+CD163−CD206+ macrophages was highest in the group with excellent embryo quality (49.7%) compared with that in the group with good embryo quality (30.2%). Likewise, the median values in the moderate- and good-quality embryo groups were 44.1% and 30.2%, respectively.
Following IL-4 stimulation, pairwise comparisons across infertility etiologies demonstrated the highest median proportion of CD68+CD163-CD206+ macrophages in women with anovulatory infertility (54.3%) compared to those with tubal-factor infertility (35.3%) and other causes of female infertility (36.9%). This pattern may reflect an impaired macrophage transition toward the classical M2 phenotype, resulting in the predominance of a functionally unstable anti-inflammatory response that may hinder the establishment of an immunologically favorable environment for embryo implantation. Similar alterations in macrophage polarization have been reported in women with polycystic ovary syndrome, in whom an imbalance between M1 and M2 macrophages was observed [16].
Notably, pairwise comparisons showed a median proportion of 35.3% in patients with tubal-factor infertility versus 54.3% in those with anovulatory infertility, whereas the corresponding median values for women with anovulatory infertility and those with other causes of female infertility were 54.3% and 36.9%, respectively. Chronic inflammation, which shifts immune homeostasis toward M1 macrophage predominance, may account for the reduced abundance of anti-inflammatory macrophages in these patients [4]. These findings may indirectly suggest that tubal-factor infertility is characterized by a distinct pattern of immune remodeling associated with chronic inflammatory tissue damage, whereas anovulatory infertility is primarily associated with impaired macrophage plasticity. In light of the current evidence demonstrating that a balanced ratio of M1-like and M2-like macrophages is essential for successful embryo implantation, the observed redistribution of CD68+CD163-CD206+ cells may represent a potentially unfavorable immunological feature for establishing an optimal implantation environment [17]. Alternatively, these findings may indicate impaired macrophage differentiation toward the classical M2 phenotype, with a shift toward an alternatively activated state in which regulatory functions coexist with moderate pro-inflammatory activity [18].
Taken together, CD68+CD163-CD206+ macrophages may serve as functional indicators of immune activation associated with impaired macrophage differentiation and an inadequate response to polarizing stimuli. Their increased abundance in specific forms of infertility may reflect distinct inflammatory and immunoregulatory alterations that influence in vitro fertilization (IVF) outcomes [19].
The proportion of CD68+human leukocyte antigen-DR (HLA-DR)+CD80− macrophages following LPS stimulation was highest in the poor-quality embryo group (median, 28.1%) than in the excellent-quality embryo group (median, 6%), suggesting a predominance of incompletely activated M1 macrophages capable of producing pro-inflammatory cytokines but exhibiting limited antigen-presenting capacity. In contrast, the highest proportion of classical M1 macrophages (CD68+HLA-DR+CD80+) was observed in patients with excellent embryo quality (median, 94%), exceeding the corresponding median values in the good-quality (88.8%) and poor-quality embryo groups (71.9 %). These findings may indicate a more balanced immune response that favors successful embryo implantation and subsequent embryonic development [20].
Following LPS stimulation, TNF-α concentrations reached their highest levels in the excellent embryo quality group (51 pg/mL), whereas lower concentrations were observed in the other groups. This finding may reflect the predominance of functionally competent M1 macrophages capable of responding to cytokine stimulation through the TLR4 signaling pathway, indicating preserved innate immune responsiveness in women with greater reproductive potential [6]. Activation of TLR4 by LPS initiates the MyD88-dependent signaling pathway, which subsequently activates the transcription factor NF-κB, thereby regulating the expression of pro-inflammatory cytokines, including TNF-α. This mechanism is supported by studies demonstrating that inhibition of TLR4 signaling leads to a corresponding reduction in TNF-α production following LPS stimulation [6].
Correlation analysis revealed consistent patterns across all embryo quality groups. M1 macrophages with CD68+HLA-DR+CD80+ and CD68+HLA-DR+CD80− phenotypes exhibited a strong inverse correlation, whereas M2 macrophages with CD68+CD163+CD206+ and CD68+CD163+CD206− phenotypes demonstrated a strong positive correlation. These findings may indirectly suggest the existence of an intrapopulation equilibrium between macrophage phenotypes within the same activation axis, inflammatory (M1) or alternatively activated (M2), whereby an increase in the proportion of functionally mature cells (e.g., CD80+ or CD206+) is accompanied by a corresponding decrease or increase in their immature or transitional counterparts (CD80− or CD206−, respectively). This observation is consistent with the concept of macrophage polarization as a continuum, in which activation phenotypes represent a spectrum of transitional states rather than discrete categories, and remain highly responsive to the local tissue microenvironment [12, 21]. This concept is particularly relevant in reproductive biology, where a balanced representation of functionally mature M1 and M2 macrophages may be essential for establishing a receptive endometrium and successful embryo implantation [4].
Limitations of the study. This study had several limitations that should be considered when interpreting the findings. First, the sample size was relatively small, particularly within subgroups stratified by infertility etiology and embryo quality. This limited the statistical power of the analyses and increased the likelihood of both false-negative findings and instability of certain between-group differences identified in the pairwise comparisons. Consequently, these associations require further validation in larger, independent cohorts.
The second important limitation is that the study was conducted using peripheral blood monocytes subsequently polarized into macrophages in vitro rather than tissue-resident macrophages derived from the endometrium, decidua, or follicular fluid. Although this experimental model enables standardized stimulation conditions and facilitates the comparison of cellular functional responses across clinical groups, it does not fully recapitulate the complex microenvironment of the reproductive tract, in which macrophage polarization is simultaneously regulated by hormones, cytokines, stromal cells, trophoblasts, and metabolic factors. Therefore, the observed phenotypic characteristics should be regarded as model-derived and not fully representative of the in vivo phenotype of tissue-resident macrophages.
Another limitation is the restricted panel of phenotypic markers (CD68, human leukocyte antigen-DR [HLA-DR], CD80, CD163, and CD206) used to characterize M1- and M2-oriented polarizations. The current understanding of macrophage biology recognizes a broad spectrum of intermediate and hybrid activation states that cannot always be accurately captured within the simplified M1/M2 framework. Accordingly, the macrophage subpopulations identified in this study should be interpreted as operational phenotypes reflecting the predominant direction of activation, rather than as completely distinct functional cell subsets.
It should also be recognized that the functional assessment of macrophage responses was largely limited to the measurement of tumor necrosis factor-α (TNF-α) and the phenotypic characterization of macrophage subpopulations. Although TNF-α is a key pro-inflammatory mediator, this single biomarker is insufficient to comprehensively characterize the functional spectrum of macrophages. Therefore, future studies should include additional inflammatory cytokines and immunoregulatory mediators, including interleukin-1β (IL-1β), interleukin-6 (IL-6), interleukin-10 (IL-10), transforming growth factor-β (TGF-β), and chemokines, together with the assessment of signaling pathways involved in macrophage polarization. Furthermore, TNF-α concentrations were measured in the cell culture supernatants using a standardized initial cell number but without additional normalization to the number of viable cells after culture. This may have influenced the absolute cytokine concentrations, particularly in the presence of between-group differences in cell viability or adhesion. Accordingly, TNF-α measurements should be interpreted as cytokine concentrations in culture supernatants under the conditions of the applied culture protocols.
It should also be emphasized that embryo quality was assessed exclusively according to morphological criteria, whereas clinically relevant outcomes, including implantation, clinical pregnancy, and live birth, were not included in the present analysis. Therefore, the identified immunological characteristics should be interpreted as being primarily associated with the embryological outcomes of the IVF cycle and do not permit direct conclusions regarding their prognostic value for pregnancy achievement or pregnancy outcome.
In addition, the correlation analysis performed in this study should be considered as descriptive and hypothesis-generating. Since macrophage subpopulations were expressed as percentages, some observed correlations may reflect the compositional nature of the data, where an increase in one cellular fraction is inherently accompanied by a relative decrease in another. Therefore, these correlations should not be interpreted as evidence of direct causal relationships.
In summary, the present findings provide important insights into macrophage polarization across different causes of infertility and varying embryo qualities. However, these findings require confirmation in larger studies incorporating tissue-derived macrophages, more comprehensive immunological profiling, and clinically relevant reproductive endpoints.
Conclusion
The present study demonstrated that the phenotypic characteristics of in vitro-induced macrophages and their cytokine activity are closely associated with reproductive outcomes in women with infertility. Poor embryo quality was associated with a predominance of the CD68+HLA-DR+CD80− macrophage subpopulation, whereas high embryo quality was characterized by increased proportions of both classical M1 macrophages (CD68+HLA-DR+CD80+) and CD68+CD163-CD206+ macrophages. These findings suggest that successful embryonic development is associated not with unidirectional immune activation but with a more balanced distribution of innate immune phenotypes. Additional evidence supporting macrophage plasticity was provided by TNF-α secretion patterns, where its concentration reached a maximum following LPS stimulation and decreased after IL-4 exposure. Notably, comparable TNF-α levels under control conditions and following LPS stimulation suggest a state of basal preactivation, highlighting the potential involvement of additional regulatory factors in shaping the immune responses. Correlation analysis further demonstrated coordinated relationships between markers of M1 and M2 polarization, indirectly supporting the concept of macrophage polarization as a phenotypic continuum rather than as a rigid dichotomous process. Analysis of the etiology of infertility revealed that anovulatory infertility was characterized by a persistently high proportion of CD68+CD163-CD206+ cells, whereas tubal factor infertility was associated with a shift toward the M1 phenotype. These observations reflect the distinct mechanisms of immune dysregulation underlying the different etiological forms of infertility. Collectively, these findings identify a candidate immunological profile that may be useful for the prognostic stratification of patients undergoing ART. Furthermore, the results provide a foundation for the development of novel immunological biomarkers of embryo quality and support the implementation of personalized approaches for infertility treatment.
References
- Корсак В.С., Смирнова А.А., Шурыгина О.В. Регистр ВРТ Общероссийской общественной организации «Российская Ассоциация Репродукции Человека». Отчет за 2022 год. Проблемы репродукции. 2024; 30(6): 8‑24. https://dx.doi.org/10.17116/repro2024300618 [Korsak V.S., Smirnova A.A., Shurygina O.V. ART Register of RAHR, 2022. Russian Journal of Human Reproduction. 2024; 30(6): 8‑24 (in Russian). https://dx.doi.org/10.17116/repro2024300618].
- Ельчанинов А.В., Фатхутдинов Т.Х. Макрофаги. М.: ГЭОТАР-Медиа; 2023. 208 с. https://dx.doi.org/10.33029/9704-7780-9-EAM-2023-1-208 [Elchaninov A.V., Fatkhudinov T.Kh. Macrophages. Moscow: GEOTAR-Media; 2023. 208 p. (in Russian). https://dx.doi.org/10.33029/9704-7780-9-EAM-2023-1-208].
- Li Y., Yu S., Huang C., Lian R., Chen C., Liu S. et al. Evaluation of peripheral and uterine immune status of chronic endometritis in patients with recurrent reproductive failure. Fertil. Steril. 2020; 113(1): 187-96.e1. https://dx.doi.org/10.1016/j.fertnstert.2019.09.001
- Park M., Kim Y.S., Song H. Macrophages: a double-edged sword in female reproduction and disorders. Exp. Mol. Med. 2025; 57(2): 285-97. https://dx.doi.org/10.1038/s12276-025-01392-6
- Robertson S.A., Moldenhauer L.M., Green E.S., Care A.S., Hull M.L. Immune determinants of endometrial receptivity: a biological perspective. Fertil. Steril. 2022; 117(6): 1107-20. https://dx.doi.org/10.1016/j.fertnstert.2022.04.023
- Sakai J., Cammarota E., Wright J.A., Cicuta P., Gottschalk R.A., Li N. et al. Lipopolysaccharide-induced NF-κB nuclear translocation is primarily dependent on MyD88, but TNFα expression requires TRIF and MyD88. Sci. Rep. 2017; 7: 1428. https://dx.doi.org/10.1038/s41598-017-01600-y
- Yao Y., Xu X.H., Jin L. Macrophage polarization in physiological and pathological pregnancy. Front. Immunol. 2019; 10: 792. https://dx.doi.org/10.3389/fimmu.2019.00792
- Zhang D., Yu Y., Duan T., Zhou Q. The role of macrophages in reproductive-related diseases. Heliyon. 2022; 8(11): e11686. https://dx.doi.org/10.1016/j.heliyon.2022.e11686
- Gardner D.K., Schoolcraft W.B. Culture and transfer of human blastocysts. Curr. Opin. Obstet. Gynaecol. 1999; 11(3): 307-11. https://dx.doi.org/10.1097/00001703-199906000-00013
- Tolstik T.V., Kirichenko T.V., Markin A.M., Bogatyreva A.I., Markina Y.V., Kiseleva D.G. et al. The association of TNF-alpha secretion and mtDNA copy number in CD14+ monocytes of patients with obesity and CHD. Front. Mol. Biosci. 2024; 11: 1362955. https://dx.doi.org/10.3389/fmolb.2024.1362955
- Luo R., Yao Y., Chen Z., Sun X. An examination of the LPS-TLR4 immune response through the analysis of molecular structures and protein-protein interactions. Cell. Commun. Signal. 2025; 23: 142. https://dx.doi.org/10.1186/s12964-025-02149-4
- Strizova Z., Benesova I., Bartolini R., Novysedlak R., Cecrdlova E., Foley L.K. et al. M1/M2 macrophages and their overlaps - myth or reality? Clin. Sci. (Lond). 2023; 137(15): 1067-93. https://dx.doi.org/10.1042/CS20220531
- Amezcua-Guerra L.M., Sánchez-Muñoz F., Guzmán-García S., Márquez-Velasco R., Becerril-Villanueva E., Vázquez-Panchos Y. et al. Mononuclear cells from patients with rhupus are influenced by TNF in their production of gp130/sIL-6Rb and APRIL. Lupus Sci. Med. 2023; 10(2): e000970. https://dx.doi.org/10.1136/lupus-2023-000970
- Ernst L.M., Freedman A.A., Odom‐Konja R.M., Keenan‐Devlin L., Miller G.E., Cole S. et al. Associations of serum inflammatory biomarkers during pregnancy with placental pathology and placental gene expression at delivery. Am. J. Reprod. Immunol. 2025; 93(4): e70062. https://dx.doi.org/10.1111/aji.70062
- Wang Q., Ismahil M.A., Zhu Y., Rokosh G., Hamid T., Zhou G. et al. CD206+ IL-4Rα+ macrophages are drivers of adverse cardiac remodeling in ischemic cardiomyopathy. Circulation. 2025; 152(4): 257-73. https://dx.doi.org/10.1161/CIRCULATIONAHA.124.072411
- Li L., Xiao Y., Wen W., Liu Q., Wei L., Liu P. et al. The role of macrophages in polycystic ovary syndrome: a review. Medicine (Baltimore) 2025; 104(17): e42228. https://dx.doi.org/10.1097/MD.0000000000042228
- Liu H., Zhang L. Decidual macrophage subsets and polarization puzzle during the human early pregnancy. Front. Immunol. 2025; 16: 1610891. https://dx.doi.org/10.3389/fimmu.2025.1610891
- Liu Y., Tan X.M., He T.T. Macrophage polarization disorder in the endometrial immune microenvironment may contribute to recurrent implantation failure. Reprod. Dev. Med. 2024; 8(3): 162-8. https://dx.doi.org/10.1097/RD9.0000000000000094
- Merkulov E.D., Prozorova A.V., Samoilova I.G., Svarovsky D.A., Sidorenkova K.A., Spirina L.V. et al. Monocyte and macrophage in follicular liquid: predictive markers of embryo quality in women with obesity and infertility. Front. Biosci. (Landmark Ed). 2025; 30(1): 26660. https://dx.doi.org/10.31083/FBL26660
- Krop J., Tian X., Van Der Hoorn M.L., Eikmans M. The mac is back: the role of macrophages in human healthy and complicated pregnancies. Int. J. Mol. Sci. 2023; 24(6): 5300. https://dx.doi.org/10.3390/ijms24065300
- Katkar G., Ghosh P. Macrophage states: there’s a method in the madness. Trends Immunol. 2023; 44(12): 954-64. https://dx.doi.org/10.1016/j.it.2023.10.006
Received 16.10.2025
Accepted 15.06.2026
About the Authors
Evgeny D. Merkulov, PhD student at the Department of Biochemistry and Molecular Biology with a course of clinical laboratory diagnostic, Siberian State Medical University, Ministry of Health of Russia, 634050, Russia, Tomsk, Moscowski Trakt str., 2, evmerc@mail.ru, https://orcid.org/0000-0002-7082-9389Dmitry A. Svarovsky, Teaching Assistant at the Department of Biochemistry and Molecular Biology with a course of clinical laboratory diagnostic, Siberian State Medical University, Ministry of Health of Russia, 634050, Russia, Tomsk, Moscowski Trakt str., 2; PhD student, Cancer Research Institute Tomsk NRMC, 634009, Russia, Tomsk, Cooperative lane, 5, svarovsky.d.a@gmail.com, Scopus AuthorID: 57417248900; eLibrary SPIN: 4131-8608, https://orcid.org/0000-0002-8985-009X
Iuliia G. Samoilova, Dr. Med. Sci., Рrofessor, Siberian State Medical University, Ministry of Health of Russia, 634050, Russia, Tomsk, Moscowski Trakt str., 2; Director of the Institute of Medicine and Medical Technologies, Novosibirsk National Research State University, +7(913)826-74-24, samoilova_y@inbox.ru,
https://orcid.org/0000-0002-2667-4842
Liudmila V. Spirina, Dr. Med. Sci., Head of the Department of Biochemistry and Molecular Biology with a course of clinical laboratory diagnostics, Siberian State Medical University, Ministry of Health of Russia, 634050, Russia, Tomsk, Moscowski Trakt str., 2, spirinalvl@mail.ru, https://orcid.org/0000-0002-5269-736X
Marina N. Stakheeva, Dr. Med. Sci., Professor, Siberian State Medical University, Ministry of Health of Russia, 634050, Russia, Tomsk, Moscowski Trakt str., 2; Leading Researcher at the Laboratory of Molecular Oncology and Immunology, Cancer Research Institute Tomsk NRMC, 634009, Russia, Tomsk, Cooperative lane, 5,
stakheyevam@oncology.tomsk.ru, https://orcid.org/0000-0003-0601-2240
Iuliia V. Okkel, PhD, Teaching Assistant, Siberian State Medical University, Ministry of Health of Russia, 634050, Russia, Tomsk, Moscowski Trakt str., 2, okkel_uv@mail.ru, https://orcid.org/0000-0001-6386-1535
Kira A. Sidorenkova, PhD student at the Department of Obstetrics and Gynecology, Siberian State Medical University, Ministry of Health of Russia, 634050, Russia, Tomsk, Moscowski Trakt str., 2, +7(952)884-37-49, kirasidorenkova@mail.ru, https://orcid.org/0009-0007-6263-6716
Ilya A. Petrov, Dr. Med. Sci., Professor at the Department of Obstetrics and Gynecology Siberian State Medical University, Ministry of Health of Russia, 634050, Russia, Tomsk, Moscowski Trakt str., 2, +7(952)899-83-66, obgynsib@gmail.com, https://orcid.org/0000-0002-0697-3896
Victoria V. Sulim, 4 year student, Siberian State Medical University, Ministry of Health of Russia, 634050, Russia, Tomsk, Moscowski Trakt str., 2, vinnnnnnyy@gmail.com, https://orcid.org/0009-0007-9099-6268
Anna S. Ulyanova, 4 year student, Siberian State Medical University, Ministry of Health of Russia, 634050, Russia, Tomsk, Moscowski Trakt str., 2, anna.ulnv0204@gmail.com, https://orcid.org/0009-0004-9313-0791
Marina I. Kubykina, obstetrician-gynecologist, reproductologist at the ART Center, Siberian State Medical University, Ministry of Health of Russia, 634050, Russia, Tomsk, Moscowski Trakt str., 2, marina.kubykina@mail.ru, https://orcid.org/0009-0002-4598-1079
Yana I. Arkhipova, obstetrician-gynecologist, reproductologist at the ART Center, Siberian State Medical University, Ministry of Health of Russia, 634050, Russia, Tomsk, Moscowski Trakt str., 2, yana_98@icloud.com, https://orcid.org/0009-0002-1062-7344
Similar Articles