Contrast-enhanced ultrasound in differential diagnosis of breast lesions
Aim. To determine the feasibility of contrast-enhanced ultrasound (CEUS) in the differential diagnosis of breast lesions.Sencha A.N., Bikeev Yu.V., Radionov V.V., Shubin L.B., Sencha E.A.
Materials and methods. This observational cohort study included results of CEUS performed in 145 women aged 17-74 (mean 45.8) years with benign and malignant nodular breast lesions. The patients were examined and treated at the V.I. Kulakov National Medical Research Center for Obstetrics, Gynecology, and Perinatology of Minzdrav of Russia, Moscow, from December 2017 to December 2018.
Results. The following eight parameters were significantly different in nodular breast lesions (p < 0.05): GOF, BI, AS, TTP, PI, DT / 2, DS, and AUC; 3 parameters (GOF, DT/2, and DS) were significantly different in the peritumoral breast parenchyma.
Conclusion. The analysis of the CEUS data identified several quantitative parameters both in the nodular breast lesions and in the peritumoral breast parenchyma that may be used for differential diagnosis.
Keywords
ultrasound
breast
cancer
contrast-enhancement
contrast agent
Breast cancer is one of the most common malignancies in women in Russia and worldwide. In 2016, in the Russian Federation, there were 642 720 women diagnosed with breast cancer (435.6 per 100 thousand population); over the past 10 years, the incidence of breast cancer has increased by more than 33.1% [1].
Sonography remains one of the most common and affordable methods of breast imaging. The sensitivity and specificity of ultrasonography (USG) for differential diagnosis between benign and malignant breast lesions ranges from 95.0-98.4% and 42-59%, respectively [2-5].
Advances in imaging technologies such as multi-parameter echography, duplex (triplex) ultrasound, multiplanar scanning, ultrasound elastography, and the use of ultrasound contrast agents have substantially improved the diagnostic value of USG [6, 8, 9].
The 2017 guidelines and recommendations for the clinical practice of contrast-enhanced ultrasound (CEUS) in non-hepatic applications stated that currently, CEUS could not be recommended for routine clinical practice, and its role in the diagnosis of breast cancer remains to be confirmed [10, 11]. Estimating angiogenesis in breast lesions has the potential for improving diagnostic effectiveness and management strategy. Contrast agents improve the visualization and registering the vascular pattern, help assess its character, and measure the phases of contrast accumulation and excretion [5, 8].
The meta-analysis by Q. Li et al. [8] reported that adding conventional ultrasound to CEUS for distinguishing breast lesions resulted in a significant improvement in sensitivity from 0.87 (95%CI: 0.84-0.90) to 0.94 (95%CI: 0.92-0.96) and specificity from 0.80 (95%CI: 0.76-0.84) to 0.86 (95%CI: 0.82-0.89).
According to Wubulihasimu M. et al. [9], CEUS sensitivity in the differential diagnosis of breast lesions did not differ from that of B-mode ultrasound (p = 0.29), but the specificity of CEUS was significantly higher than that of B-mode ultrasound (p < 0.01).
To date, there are no studies in the domestic literature that specifically analyzed the CEUS qualitative and quantitative characteristics in the diagnosis of breast lesions.
Material and methods
This study included results of CEUS performed from December 2017 to December 2018 in 145 women aged 17-74 (mean 45.8) years with benign and malignant nodular breast lesions.
Patients were divided into two groups. Group 1 included 82 patients aged 34–71 (mean 52.4) years, who were diagnosed with breast cancer. Breast cancer stage 0, stage I, stage II, stage III, and stage IV (multiple metastases to the liver) was diagnosed in 4 (4.8%), 30 (36.6%), 34 (41.5%), 13 (15.9%), and one patient, respectively. Twelve patients had multicentric/multifocal breast cancer (2 or more tumors). The histological structure consisted mainly of carcinoma of no special type also known as invasive ductal carcinoma (63.4%).
Seventy-four patients underwent surgery at the Department of Breast Diseases, V.I. Kulakov NMRC for OG&P of Minzdrav of Russia. Eight patients received complex therapy, which began with drug therapy. Before treatment, all patients underwent a core biopsy of the nodular breast lesions with morphological and immunohistochemical examination of the biopsy specimens.
Group 2 included 63 patients with benign breast tumors. The age of patients with a nodal mastopathy ranged from 17 to 69 (mean 37.8) years. Fibroadenomas, fibrocystic mastopathy (FCM), and lactational mastitis abscess formation were found in 43 (68.2%), 18 (28.6%), and 2 (3.2%) patients, respectively. Fifty patients underwent a sector resection of the breast. Two patients with abscesses of lactational mastitis were treated with abscess incision and drainage. Eleven patients had only morphological verification (FNAB or core biopsy of the lesions) and remained under outpatient medical supervision.
CEUS was performed using a DC-8 ultrasound system (Mindray, China) with a multi-frequency linear transducer operating in the frequency range 7.5–15.0 MHz in the contrast mode with a low mechanical index (MI <0.10). The contrast agent used in the study was SonoVue (SonoVue, Bracco, Italy) (2.4 ml), which contains sulfur hexafluoride microbubbles (the State Registration No. 20-2-404006 /R/ RLP-U dated 08/05/2013, Ministry of Health of the Russian Federation).
The study was conducted in two stages. At the first stage, all 145 patients underwent multiparametric breast USG using grayscale, color-coded sonography, and elastography (compression and shear wave). Evaluation and interpretation of breast lesions and the subsequent selection of the US BI-RADS category were made based on all ultrasound characteristics including number, location, qualitative structural characteristics, the shape of outer contours, vascularization, condition of surrounding tissues, and the state of regional lymph nodes.
At the second stage, after obtaining the patient’s written informed consent for the procedure, the patients underwent CEUS, which was performed according to established aseptic techniques for minimally invasive procedures. The contrast agent (2.4 ml) was administered intravenously via a 20-G catheter placed in a cubital vein, followed by 5 mL 0.9% NaCl saline solution. Simultaneously with the contrast agent injection, the countdown began, and the cine-loop was recorded (at least 120 seconds) and stored in the memory of the ultrasound scanner.
At the post-processing stage, we analyzed CEUS qualitative and quantitative parameters using the Contrast QA software. The segments of the cine-loop were taken for analysis from the moment the contrast agent injection until it was completely washed out (the object of interest was scanned during the entire study time, at least 120 s).
Quantitative assessment of the contrast enhancement parameters of nodular lesions and breast parenchyma was carried out based on the ratio of time and intensity of accumulation and distribution of contrast agent. In nodular lesions, zones of interest measuring 4–7 mm in diameter (ROI 1) were distinguished.
CEUS-measured tumor sizes of 65.8% malignant and 25% benign nodular lesions were larger than measured using B-mode ultrasound. Therefore, to obtain quantitative characteristics of the contrasted surrounding tissues, the second zone of interest (ROI 2 with a diameter of 4-7 mm) was in the peri-tumoral parenchyma at a distance of 5–9 mm from the nodular lesion border. Provided that the test conditions are met, the image-processing procedure was performed automatically and displayed on the screen as data tables (Fig. 1-2).

We evaluated the following quantitative characteristics:
- GOF (Goodness of Fit): to calculate the fit degree of the curve; range: 0-1, where 1 means the fit curve fits the raw curve perfectly;
- BI (Base Intensity): the basic intensity of no contrast agent perfusion status;
- AT (Arrival Time, s): time point where contrast intensity appears higher than the base intensity;
- AS (Ascending Slope, dB/s): ascending slope of contrast, the slope between the start point of lesion perfusion to the peak;
- TTP (Time To Peak, s): the time when the contrast intensity reaches peak value;
- PI (Peak Intensity, dB): contrast peak intensity;
- Half-life (DT/2, s): the time when the intensity is half the value of the peak intensity;
- DS (Descending Slope, dB/s): descending slope of the curve;
- AUC (Area Under Curve, dB/s): the area under the time-intensity curves during contrast.

Statistical analysis. The distribution of continuous variables was tested for normality using the Shapiro-Wilk test. Quantitative variables showing normal distribution were expressed as means (M) and standard deviation (SD) and presented as M (SD) and 95% confidence interval for the mean (95% CI). If the results showed that the variables were not normally distributed, the median (Me) and the quartiles Q1 and Q3 in the Me (Q1; Q3) format were reported. Based on the normality of the data assessed by the Shapiro-Wilk W test, the differences between continuous variables were evaluated with a Student’s t or Mann-Whitney U test. The critical level of significance when testing statistical hypothesis was considered at p <0.05. Data were analyzed using the Stata/MP software version 14.0 [7].
Results and discussion
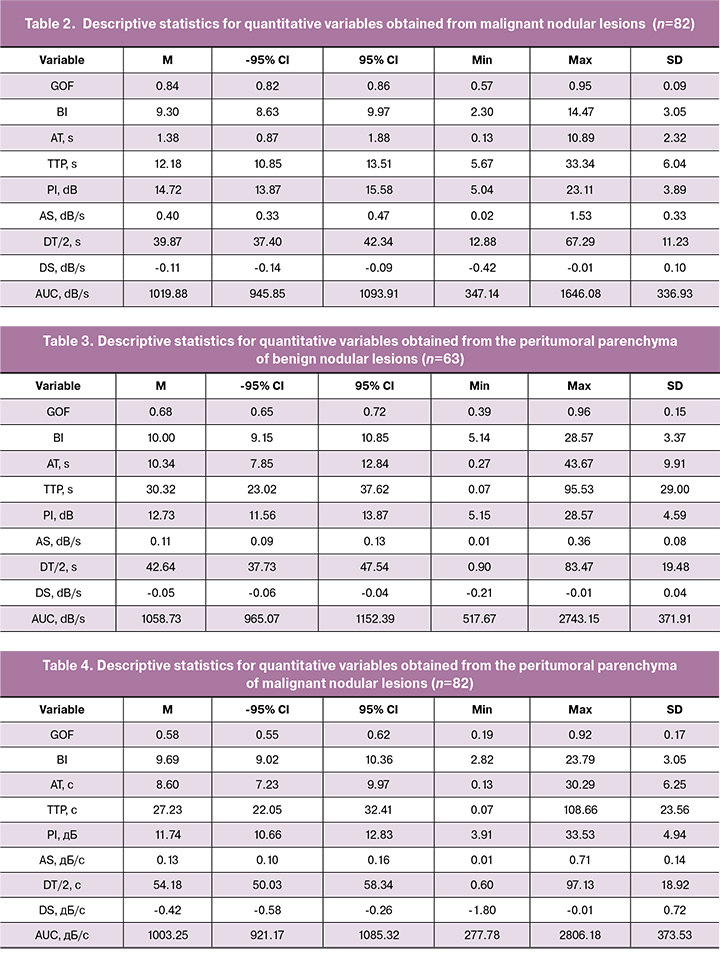
A summary of quantitative characteristics obtained by CEUS in benign and malignant breast lesions is presented in Tables 1–2; quantitative characteristics of the peritumoral parenchyma of benign and malignant tumors are summarized in Tables 3-4.
A comparative assessment of quantitative parameters obtained by CEUS in malignant and benign breast lesions is presented in Table 5.
There were 8 statistically significantly different parameters in breast nodal lesions, namely: GOF, BI, AS, TTP, PI, DT/2, DS, and AUC. Mean values of GOF [0.84 (0.09)], BI [9.30 (3.05)], AS [0.40 (0.33) dB/s], PI [14.72 (3, 89) dB], DS [0.11 (0.10) dB/s], and AUC [1019.88 (336.93) dB/s] were statistically significantly higher in malignant than in benign lesions (GOF [0.77 (0.14)], BI [8 , 05 (3.04)], AS [0.22 (0.18) dB/s], PI [11.73 (3.84) dB], DS [0.59 (0.05) dB/s], and AUC [834.75 (315.57) dB/s]). In benign tumors, the mean TTP was 17.90 (11.64) s, which is statistically significantly higher than that in malignant neoplasms [12.18 (6.04) s], while the probability of error did not exceed 0.001. The mean DT/2 in benign lesions was also statistically significantly higher than in malignant tumors [(46.80 (9.99) s] and [39.87 (11.23) s], respectively.

No statistically significant differences were found in mean arrival times (AT) of the contrast agent between benign and malignant nodules.
Mean peak intensity (PI) was significantly higher in malignant tumors, which may be attributed to higher blood flow through an increased number of arteriovenous shunts, which is characteristic of malignant neovascularization. The high area under the time-intensity curve (AUC) can be explained by the higher concentration of contrast agent in the pronounced vasculature of malignant tumors (according to Du J. [12], microvascular density is statistically significantly higher in malignant tumors).
In malignant tumors, the time-intensity curve was characterized by a shorter time to peak, higher PI, larger AUC, and shorter half-life (DT/2).
Among quantitative parameters obtained in the peritumoral parenchyma (Table 6), GOF, DT/2, and DS were significantly different in benign and malignant lesions.
The mean GOF and DS in the peritumoral parenchyma of benign tumors [0.68 (0.15) and -0.05 (0.04) dB/s)] were statistically significantly higher than that in the peritumoral parenchyma of malignant tumors [0.58 (0.17) and -0.42 (0.72) dB/s)]. The mean DT/2 was 54.18 (18.92) s in the peritumoral parenchyma of malignant tumors, which was statistically significantly higher than in the peritumoral parenchyma of benign lesions [42.63 (19.48) s], while the probability of error did not exceed 0.001.
Conclusion
Therefore, quantitative CEUS parameters can be used in the differential diagnosis of breast tumors. Statistically significant differences between benign and malignant breast lesions were found in eight parameters (GOF, BI, AS, TTP, PI, DT / 2, DS, and AUC) and three parameters in the peritumoral parenchyma (GOF, DT/2, and DS).
Quantitative CEUS parameters closely correlate with microvascular density and reflect hemodynamic processes and neo-angiogenesis in a breast tumor. The diameter of microbubbles of the second-generation contrast agent such as SonoVue is similar to that of red blood cells (2-3 μm), which allows dynamic observation and study of tumor vessel perfusion. Therefore, it is possible to use CEUS for evaluation of breast tumor angiogenesis in vivo.
We conclude that the analysis of the CEUS data identified several quantitative parameters for assessing both nodular breast lesions and the peritumoral parenchyma that appear promising for differentiating benign from malignant breast lesions. Further studies are needed to validate these findings.
References
- Каприн А.Д., Старинский В.В., Петрова Г.В., ред. Состояние онкологической помощи населению России в 2017 году. М.: МНИОИ им. П.А. Герцена – филиал ФГБУ «НМИЦ радиологии» Минздрава России; 2018. 236 с. [Kaprin A.D., Starinsky V.V., Petrova G.V., ed. The status of cancer care for the population of Russia in 2017. M .: MNII them. P.A. Herzen - a branch of the Federal State Budgetary Institution Scientific Research Center for Radiology of the Ministry of Health of Russia; 2018. 236 s. (in Russian)].
- Гажонова В.Е., Ефремова М.П., Дорохова Е.А. Современные методы неинвазивной лучевой диагностики рака молочной железы. РМЖ. 2016; 5: 321-4. [Gajonova V.E., Efremova M.P., Dorokhova E.A. Modern methods of non-invasive radiation diagnosis of breast cancer. Breast cancer. 2016; 5: 321-4. (in Russ.)].
- Сенча А.Н. Ультразвуковое исследование молочных желез. Шаг за шагом. От простого к сложному. М.: МЕДпресс-информ; 2018. 184 с. [Sencha A.N. Ultrasound examination of the mammary glands. Step by step. From simple to complex. M .: MEDpress-inform; 2018.184 s.
- Leutch W. Teaching atlas of breast ultrasound. Stuttgart: Thieme; 1992: 67-81.
- Sardanelli F., Podo F., Santoro F., Manoukian S., Bergonzi S., Trecate G. et al. Multicenter surveillance of women at high genetic breast cancer risk using mammography, ultrasonography, and contrast-enhanced magnetic resonance imaging. Invest. Radiol. 2011; 46(2): 94-105. doi: 10.1097/RLI.0b013e3181f3fcdf.
- Бикеев Ю.В., Сенча А.Н., Родионов В.В., Шубин Л.Б., Сенча Е.А. Качественный анализ ультразвукового исследования с применением контрастного препарата в дифференциальной диагностике узловых образований молочной железы. Медицинская визуализация. 2019; 1: 87-96. [Bikeev Y.V., Sencha A.N., Radionov V.V., Shubin L.B., Sencha E.A. Qualitative analysis of contrast-enhanced ultrasound in differential diagnosis of breast lesions. Medical Visualization. 2019;(1):87–96. (In Russ.)]. https://doi.org/10.24835/1607-0763-2019-1-87-96
- Ланг Т.А., Сусик М. Как описывать статистику в медицине. Руководство для авторов, редакторов и рецензентов. Пер. с англ. Леонов В.П., ред. М.: Практическая медицина; 2011. 480 с. [Lang TA, Sesik M. How to describe statistics in medicine. A handbook for authors, editors and reviewers / trans. with English. Leonova V.P. ed. M.: Practical Medicine; 2011. 480 p.
- Li Q., Hu M., Chen Z., Li C., Zhang X., Song Y., Xiang F. Meta-analysis: contrast-enhanced ultrasound versus conventional ultrasound for differentiation of benign and malignant breast lesions. Ultrasound Med. Biol. 2018; 44(5): 919-29. doi: 10.1016/j.ultrasmedbio.2018.01.022.
- Wubulihasimu M., Maimaitusun M., Xu X.L., Liu X.D., Luo B.M. The added value of contrast-enhanced ultrasound to conventional ultrasound in differentiating benign and malignant solid breast lesions: a systematic review and meta-analysis. Clin. Radiol. 2018; 73(11): 936-43. doi: 10.1016/j.crad.2018.06.004.
- Sidhu P.S., Cantisani V., Dietrich C.F., Gilja O.H., Saftoiu A., Bartels E., et al. The EFSUMB guidelines and recommendations for the clinical practice of contrast-enhanced ultrasound (CEUS) in non-hepatic applications: update 2017 (long version). Ultraschall Med. 2018; 39(2): e2-44. doi: 10.1055/a-0586-1107
- Yuan Z., Quan J., Yunxiao Z., Jian C., Zhu H., Liping G. Diagnostic value of contrast-enhanced ultrasound parametric imaging in breast tumors. J. Breast Cancer. 2013; 16(2): 208-13. doi: 10.4048/jbc.2013.16.2.208
- Du J., Li F.H., Fang H., Xia J.G., Zhu C.X. Correlation of real-time gray scale contrast-enhanced ultrasonography with microvessel density and vascular endothelial growth factor expression for assessment of angiogenesis in breast lesions. J. Ultrasound Med. 2008; 27(6): 821-31. DOI: 10.7863/jum.2008.27.6.821
Received 27.05.2019
Accepted 21.06.2019
About the Authors
Alexandr N. Sencha, M.D., Ph.D., Head of Radiology Division, National Research Center for Obstetrics, Gynecology and Perinatology, Moscow.Yury V. Bikeev, M.D., Ultrasound Diagnostics Department, National Research Center for Obstetrics, Gynecology and Perinatology, Moscow. Тел.: +7 (903) 713-03-03.
E-mail: yu.bikeev@gmail.com
Valery V. Rodionov, M.D., Ph.D., Professor, Head of Breast pathology Department, National Research Center for Obstetrics, Gynecology and Perinatology, Moscow.
Leonid B. Shubin, M.D., Ph.D., Associate Professor, Division of Pathology, Yaroslavl State Medical University, Yaroslavl.
Ekaterina A. Sencha, M.D., Ultrasound Diagnostics Department, Medical Diagnostic Center No. 9, Moscow.
For citations: Sencha A.N., Bikeev Yu.V., Rodionov V.V., Shubin L.B., Sencha E.A. Contrast-enhanced ultrasound in differential diagnosis of breast lesions .
Akusherstvo i Ginekologiya/ Obstetrics and gynecology. 2019; 11: 167-74. (In Russian).
https://dx.doi.org/10.18565/aig.2019.11.167-174
Similar Articles