Clinical characteristics and analysis of changes in amino acid and organic acid profiles in the urine of patients at risk of preeclampsia
The etiology of preeclampsia remains unclear; however, pathophysiological changes in multiple metabolic pathways are observed in this condition. Studying urine metabolites in preeclampsia can help identify potential biomarkers for improved clinical diagnosis and enhance our understanding of the mechanisms underlying its development. Objective: To determine the characteristic features of urine composition in pregnant women at risk of preeclampsia or in those who have developed preeclampsia. Materials and methods: The study utilized urine samples collected from pregnant women at 11–14, 22–25, and 32–35 weeks of gestation. Patients were categorized into three groups: Group I consisted of 13 women with physiological pregnancies, Group II comprised 13 patients at high risk of developing preeclampsia, and Group III included five pregnant women with diagnosed preeclampsia. Clinical, laboratory, and instrumental methods, including extended combined first-trimester screening, were employed. Additionally, the composition of amino acids and organic acids in the urine was analyzed using liquid chromatography with mass spectrometric detection. Results: Preeclampsia diagnosis was based on the 2021 clinical guidelines of the Ministry of Health of Russia. Group III exhibited a significantly higher incidence of complicated obstetric and gynecological history, including antenatal fetal death (n=2, 40%) and a history of preeclampsia (n=3, 60%), than Group II, where only one patient (7.7%) had a history of preeclampsia. The patients in the control group did not have a complicated reproductive history (p<0.001). Chronic arterial hypertension was more prevalent in Group III (n=4, 80%). Significant differences were observed in the levels of proline, aspartate, and malic acid when comparing Group I to Group III, as well as proline, alpha-ketoglutarate, and 3-hydroxy-3-methylglutaric acid when comparing Group II to Group III Conclusion: This study identified specific urinary metabolites whose levels were significantly different in patients with a healthy pregnancy, patients at risk of developing preeclampsia, and those diagnosed with preeclampsia at different gestational ages. Urine metabolite profiling is a promising method for predicting pre-eclampsia. Authors' contributions: Oshkhunova M.S., Muminova K.T., Gorina K.A. – review of the relevant literature, laboratory and clinical data collection and analysis, manuscript drafting; Khodzhaeva Z.S., Frankevich V.E. – analysis of the study results, manuscript drafting, editing and approval of the final version of the manuscript; Chagovets V.V., Novoselova A.V. – performance of laboratory studies, statistical analysis, manuscript drafting. Conflicts of interest: The authors have no conflicts of interest to declare. Funding: The study was performed within the framework of the State task of the Ministry of Health of the Russian Federation № 121040600435-0 "Rationale for personalized approaches to antihypertensive therapy in HDP and preeclampsia". Ethical Approval: The study was reviewed and approved by the Research Ethics Committee of the V.I. Kulakov NMRC for OG&P. Patient Consent for Publication: All patients provided informed consent for the publication of their data. Authors' Data Sharing Statement: The data supporting the findings of this study are available on request from the corresponding author after approval from the principal investigator. For citation: Oshkhunova M.S., Chagovets V.V., Novoselova A.V., Muminova K.T., Gorina K.A., Khodzhaeva Z.S., Frankevich V.E. Clinical characteristics and analysis of changes in amino acid and organic acid profiles in the urine of patients at risk of preeclampsia. Akusherstvo i Ginekologiya/Obstetrics and Gynecology. 2023; (8): 56-66 (in Russian) https://dx.doi.org/10.18565/aig.2023.48Oshkhunova M.S., Chagovets V.V., Novoselova A.V., Muminova K.T., Gorina K.A., Khodzhaeva Z.S., Frankevich V.E.
Keywords
preeclampsia
preeclampsia diagnostics
omics technology
metabolomics
mass spectrometry
Preeclampsia, a polyetiological clinical syndrome, typically develops after 20 weeks of pregnancy and is specific to both the pregnancy and postpartum period. It is a major cause of maternal and perinatal morbidity and mortality, and affects the subsequent quality of life of women, even if the birth outcome is favorable. The incidence of preeclampsia ranges from 2% to 8% among pregnant women, with 10–15% of maternal deaths directly attributed to preeclampsia and eclampsia [1].
The search for predictive molecules for preeclampsia continues. However, owing to the heterogeneity of the syndrome, the existence of a single biomarker capable of predicting all forms of preeclampsia-related disorders remains unclear. In recent years, researchers have shown interest in post-genomic changes, particularly in the context of metabolomic profiles. Although metabolomic analysis has the potential to deeply explore preeclampsia and other hypertensive disorders, such studies remain limited. Notably, investigations into urine metabolomics for preeclampsia are scarce, despite urine being an accessible and noninvasive sample. While most studies have focused on analyzing blood plasma and serum [2, 3], urine composition serves as an informative research target, reflecting physiological processes within the body.
This study examined the levels of amino acids and organic acids in the urine of patients at risk of preeclampsia, those diagnosed with preeclampsia, and those with uncomplicated pregnancies.
This study aimed to determine the characteristic features of urine composition in pregnant women at risk of preeclampsia and in those who developed preeclampsia.
The outcomes of this analysis could potentially reveal metabolic biomarkers that enhance existing risk prediction models, aid in clinical diagnosis, and deepen the understanding of specific metabolic mechanisms in preeclampsia.
Materials and methods
The study included 27 patients treated at the V.I. Kulakov NMRC for OG&P under the Russian Ministry of Health. Participants were categorized into three groups: Group I comprised 13 women with physiological pregnancies, Group II included 13 patients at high risk of developing preeclampsia, and Group III consisted of five pregnant women diagnosed with preeclampsia. Inclusion in the high-risk preeclampsia group was based on the results of extended combined screening during the first trimester, with values ≤1:100 up to 34 weeks and/or up to 37 weeks of pregnancy. Preeclampsia diagnosis adhered to the 2021 clinical guidelines of the Ministry of Health of Russia [4].
The inclusion criteria for the control group were individuals aged over 18 years, with singleton spontaneous pregnancies, and having provided informed consent before participating in the study. Exclusion criteria comprised multiple pregnancies, diabetes mellitus, autoimmune diseases, cancer, kidney disease in a state of decompensation, and premature rupture of membranes.
For analysis, an average portion of urine was collected after preliminary hygiene procedures. In the process of preparation for amino acid analysis, 480 µL of a chloroform/methanol solution (3/1 v/v) was added to 200 µL of a urine sample, stirred for 10 min, centrifuged for 10 min at 13,000 × G, after which 200 µL of the upper phase was taken, dried in nitrogen flow, and dissolved in 500 μl of acetonitrile/water (1/1 v/v).
For the analysis of organic acids, 850 µL of methanol was added to 100 µL of urine, stirred for 5 min, centrifuged for 10 min at 13000 × G, and 200 µL was transferred into a chromatographic vial.
Samples were analyzed by high-performance liquid chromatography on a 1260 Infinity II chromatograph (Agilent, USA) with detection on a 6460 Triple Quad mass spectrometer (MS) (Agilent, USA). The samples were separated by liquid chromatography using Jasem columns for the analysis of amino acids or organic acids.
For the analysis of amino acids, 15 µL of the sample was injected and the following eluents were used, supplied at a flow rate of 700 µL/min with a column temperature maintained at 30°C, as the mobile phase: eluent A – water with the addition of 0.1% formic acid, eluent B – acetonitrile with the addition of 0.1% formic acid. The mobile phase composition during the analysis varied as follows: 0–1 min. – 78% B; up to the 4th minute, the volume fraction of eluent B decreased to 20%, kept the value up to 4.5 minutes, and returned to 78% in 0.1 minutes.
For organic acid analysis, 10 µL of sample was injected and eluents A and B from Jasem for organic acid analysis were fed at a flow rate of 500 µL/min with the column maintained at 40°C. The composition of the mobile phase during the analysis was as follows:0–2 min. – 5% B; up to 2.1 minutes, the volume fraction of eluent B increased to 35%, kept the value up to 4.5 minutes, increased to 80% in 0.1 minutes, was held at this value for 3.4 minutes and returned to the value of 35% in 0.1 minutes.
Parent-child transitions for the analyzed amino acids and organic acids are provided in the JASEM manual.
The metabolite levels were determined using the QuantAnalysis program (Agilent, USA).
Statistical analysis
Statistical analysis was performed using the StatTech v. 3.1.6 (Stattech, Russia). The distribution of continuous variables was tested for normality using the Shapiro-Wilk test or Kolmogorov–Smirnov test. Data with non-normal distribution are reported as median (Me) and interquartile range (Q1; Q3). Kruskal–Wallis test was used to compare numerical data between three or more groups, followed by Dunn’s multiple comparison test with Holm's correction. Categorical data are presented as counts and percentages. For normally distributed continuous variables, differences among groups were tested using one-way analysis of variance (ANOVA) followed by the Games–Howell test. Pearson's chi-square test (χ2) was used to compare percentages using multiway contingency tables. Differences were considered statistically significant at p<0.05.
Statistical processing of the experimental data was performed using scripts written in R [R Core Team (2018). R: Language and environment for statistical computing. R Foundation for Statistical Computing, Vienna, Austria. URL http://www.R-project.org/] in RStudio [RStudio Team (2016). RStudio: Integrated Development for R. RStudio, Inc., Boston, MA URL http://www.rstudio.com/].
The organic and amino acid contents in the sample were estimated semi-quantitatively by the relative level of the analyte, which was calculated by dividing the area of the chromatographic peak of the corresponding analyte by the total area of the analyte peaks in this sample.
The levels of organic and amino acids were compared using the nonparametric Wilcoxon–Mann–Whitney test. The median (Me) and quartiles Q1 and Q3 were used to describe the quantitative data. The threshold significance level p was set to 0.05.
In addition, multivariate orthogonal projections to latent structures discriminant analysis (OPLS-DA) was used to classify the samples [5]. OPLS-DA was implemented using the ropls library [6]. The quality of the OPLS-DA models was assessed by their ability to describe the variance of the analyzed data (R2) and predict possible new data (Q2). The Q2 parameter was calculated using 7-fold cross-validation. When Q2≥0.4, the model can be used to assign the analyzed samples to one or more clinical subgroups. In addition, OPLS-DA was used to identify the metabolites that were most significant for classification. This was done by analyzing the variable influence on the projection VIP. Substances with a VIP>1 were classified as potential marker metabolites [5].
The involvement of the studied compounds that were significant for the considered pathology in the metabolic pathways was analyzed using MetaboAnalyst 5.0 resource (https://www.metaboanalyst.ca/home.xhtml).
Results
The age of the patients in all groups varied from 26 to 42 years, with an average of 32.74 (3.81) years, including 31.92 (3.64), 32.69 (3.81), and 35 (5.29) years in Groups I, II, and III, respectively. There were no significant differences in age between the study groups. The mean body mass index (BMI) was 25 (3), 27.30 (4.11), and 34.6 (10.7) kg/m² in Groups I, II, and III, respectively, with no significant differences (p=0.110) (Table 1).
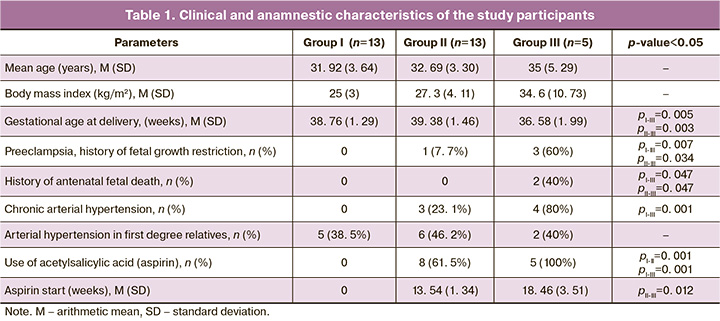
In Group III, women significantly more often had a complicated obstetric and gynecological history, including antenatal fetal death in two (40%) women and a history of preeclampsia in three (60%) women, while in Group II, only a history of preeclampsia was noted in one (7.7%) case. In the control group, reproductive history was not complicated (p<0.001).
Chronic arterial hypertension was significantly more common in Group III – 4 (80%) than in the control group, where this disease was not recorded (p=0.001). Statistically significant differences were found in gestational arterial hypertension, which was diagnosed only in Group II in 4/13 (30.8%) patients (p=0.042).
The average risk of developing preeclampsia according to the extended combined first-trimester screening was 1:57 and 1:33 in Groups II and III, respectively, which was significantly higher than that in Group I, with a risk of 1:2435 (p=0.001). Acetylsalicylic acid at a dose of 150 mg was administered to 8/13 (61.5%) patients in Group II, while this preeclampsia prophylaxis was administered to all patients in Group III. At the same time, the mean time to start taking acetylsalicylic acid was 13.54 (1.34) weeks in Group II and 18.46 (3.51) weeks in Group III (p=0.012). Probably, one of the factors in the development of preeclampsia in this group was the delayed initiation of acetylsalicylic acid administration. The gestational age at delivery was significantly lower in Group III than in Groups I and II (36.58 (1.99), 38.76 (1.29) and 39.38 (1.46) weeks, respectively); p=0.005). Accordingly, patients in Group III were discharged from the hospital significantly later than those in Groups I and II (p=0.001).
Earlier gestational age at delivery in Group III was reflected in lower neonatal birth weight – 2502.40 (774.75) g versus 3394.69 (447.59) g in Group I and 3340.77 (497.46) g in Group II (p=0.008). In this regard, the discharge of newborns occurred much later in Group III (5.2 (1.78) days) than in Groups I and II (3.34 (0.58); 3.44 (0.88) days, respectively) (p=0.003).
During the analysis, data were obtained on the relative contents of 21 amino acids and 13 organic acids in the urine of pregnant women. Amino acids included L-tryptophan, L-tyrosine, taurine, L-phenylalanine, L-valine, L-methionine, aspartic acid, L-norvaline, L-homocitrulline, L-serine, L-threonine, sarcosine, L-alanine, L-glutamine, glycine, trans-4-hydroxy-L-proline, L-glutamic acid, L-asparagine, L-proline, L-citrulline, and L-cystine. Organic acids for which the LC-MS signal was registered included 2-hydroxy-butyric acid, 2-hydroxy-glutaric acid, 3-hydroxy-3-methylglutaric acid, 3-hydroxy-glutaric acid, 3-hydroxy-isobutyrate, alpha-ketoglutaric acid, citric acid, glycolic acid, lactic acid, malic acid, methylmalonic acid, N-acetyl-aspartic acid, pyruvic acid. Dynamic monitoring of patients with urine sampling was carried out at 11–14, 22–25, and 32–35 weeks of pregnancy (study points), as well as at the time of the clinical manifestation of preeclampsia.
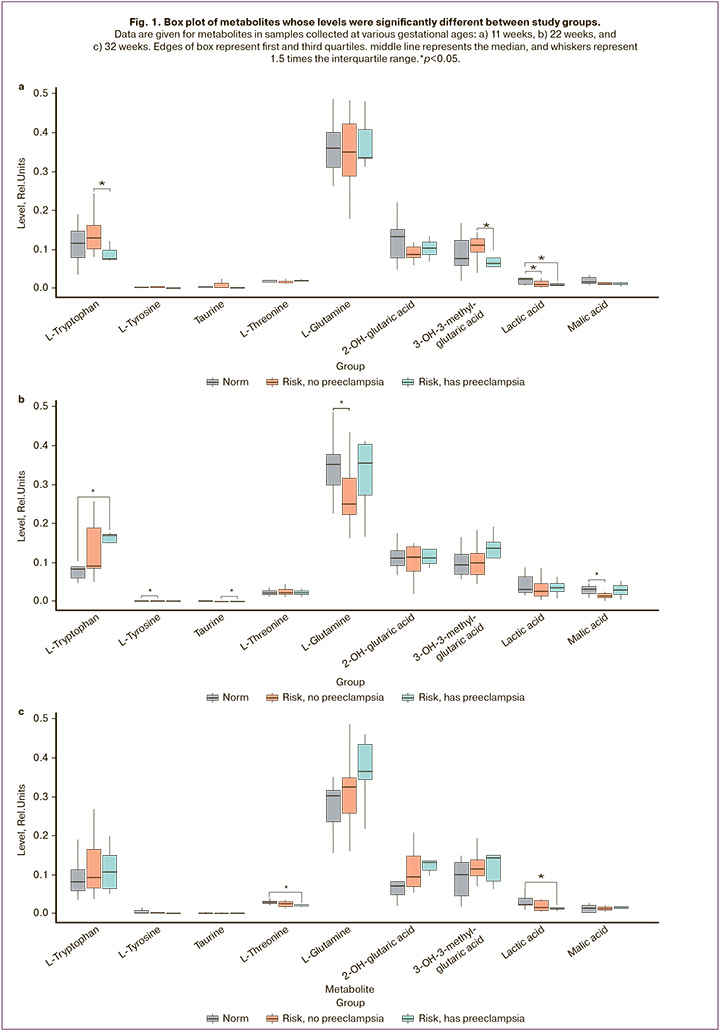
Statistically significant differences in the levels of metabolites in Groups I and II were found for lactic acid (p=0.03) during 11–14 weeks of gestation, and for tyrosine (p=0.05), glutamine (p=0.03), and malic acid (p=0.01) during 22–25 weeks of gestation. During 32–35 weeks of gestation no statistically significant differences were found. A similar comparative analysis of metabolite levels in Groups I and III revealed statistically significant differences for the following metabolites: lactic acid (p=0.04) at 11–14 weeks of gestation, tryptophan at 22–25 weeks of gestation (p=0.02), threonine (p=0.03), and lactic acid (p=0.05) at 32-35 weeks of gestation. Of interest are the differences between patients in Group II (patients at risk who did not develop preeclampsia) and Group III (patients at risk of developing and clinically manifesting preeclampsia). Thus, the levels of tryptophan (p=0.05) and 3-hydroxy-3-methylglutaric acid (p=0.05) were significantly different in the samples collected at 11–14 weeks of gestation, as well as taurine (p=0.05) at 22–25 weeks of gestation. These findings make it possible to isolate biomarkers for a model for predicting the development of preeclampsia in high-risk patients.
To search for the features of the dynamics of changes in the level of the studied metabolites between the three groups of patients, we first calculated the relative standard deviation of the levels between the three points of the study indicated above for each patient, and then compared these indicators between the groups using the Wilcoxon–Mann–Whitney test (Fig. 1). There were statistically significant differences in the dynamics of changes in the levels of proline, aspartate, and malic acid when comparing Groups I and III, as well as for proline, alpha-ketoglutarate, and 3-hydroxy-3-methylglutaric acid when comparing Groups II and III.
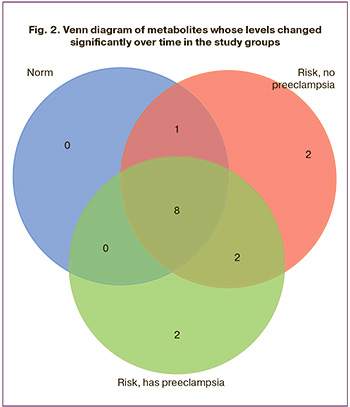
In addition, metabolites were noted in which the group-averaged relative standard deviation exceeded 50%, that is, metabolites whose levels changed markedly over time. For the group with uncomplicated pregnancy, there were 9 such metabolites: norvaline, lactic acid, tyrosine, malic acid, phenylalanine, methionine, citric acid, taurine, and cystine; for Group II there were 13 metabolites: malic acid, valine, phenylalanine, homocitrulline, acetylaspartate, trans-4-hydroxyproline, norvaline, tyrosine, methionine, lactic acid, citric acid, taurine, cystine; for Group III – 12 metabolites: homocitrulline, proline, acetylaspartate, lactic acid, methionine, norvaline, tyrosine, aspartate, phenylalanine, citric acid, cystine, taurine. Figure 2 shows the Venn diagram of the metabolites. A significant change in the levels of metabolites, presented only in Group II, was observed for trans-4-hydroxyproline and valine. Aspartate and proline were unique in terms of changes over time in Group III. Although no statistically significant between-group differences were found for these compounds, attention should be paid to them because the dynamics of the levels of these metabolites differ from the physiological pregnancy group and differ between Groups II and III.
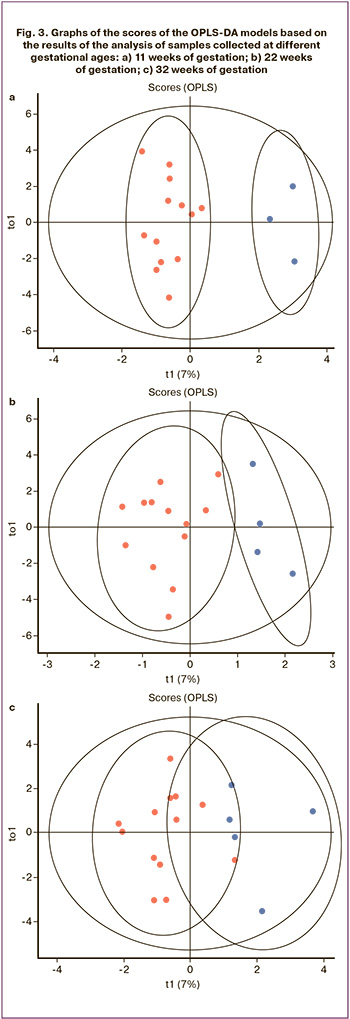
The feasibility of predicting the development of preeclampsia based on the metabolomic composition of the urine was assessed using the OPLS-DA method. This approach is a modification of the Principal Components Method developed for building supervised models. The results of the OPLS-DA are presented in Figure 3 in the form of score charts. Points corresponding to samples from patients who developed preeclampsia and those without clinical manifestations of preeclampsia were divided into two clusters, which indicated noticeable differences in the profiles of organic and amino acids in the compared groups. The following metabolites made the greatest contribution to sample clustering: at 11–14 weeks of gestation they were alpha-ketoglutaric acid, 3-hydroxy-3-methylglutaric acid, phenylalanine, tryptophan, proline, trans-4-hydroxyproline, glycolic acid, tyrosine, 2 -hydroxy-butyric acid, taurine, aspartic acid, methylmalonic acid; at 22–25 weeks of gestation – methionine, 3-hydroxy-isobutyrate, taurine, asparagine, norvaline, serine, aspartic acid, threonine, acetylaspartic acid, puruvic acid, tyrosine; at 32–35 weeks of gestation – cystine, glutamic acid, tyrosine, glutamine, phenylalanine, malic acid, threonine, sarcosine, alanine, aspartic acid, valine, methylmalonic acid, asparagine, and norvaline.
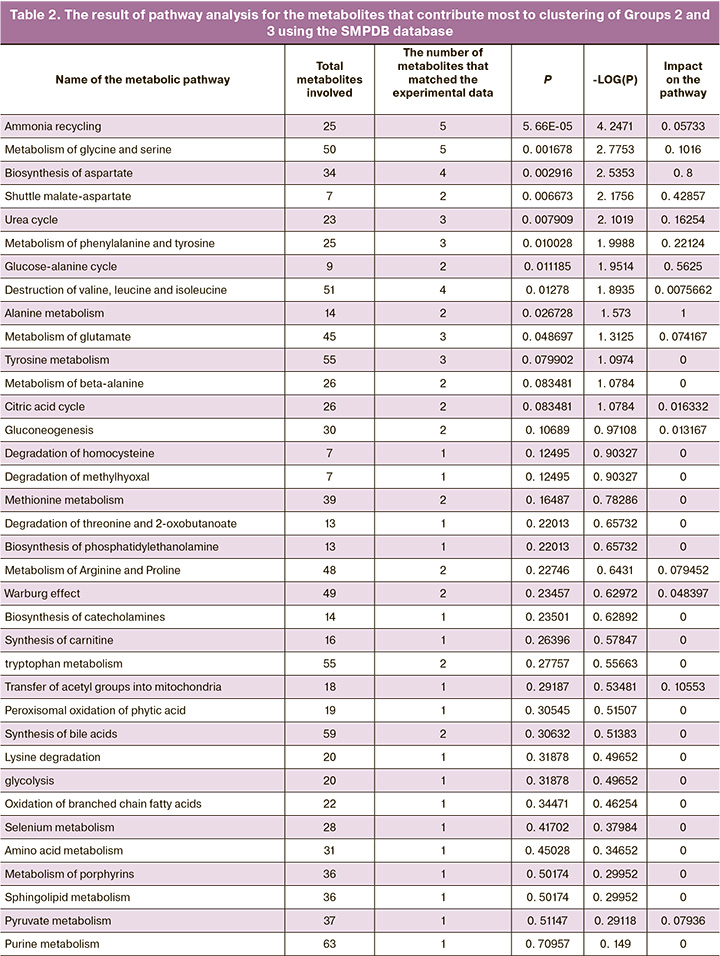
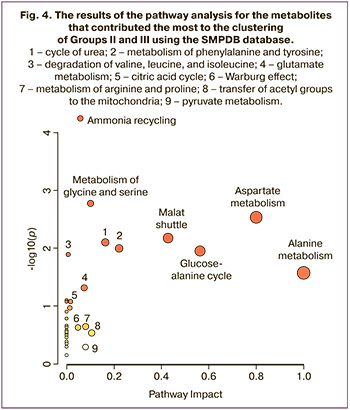
Bioinformatics analysis of metabolites with the greatest contribution to sample clustering was performed using MetaboAnalyst. Biological networks that could potentially be involved in the pathophysiology of preeclampsia have also been identified. Networks of metabolic pathways were built considering the differences in metabolites in Groups II and III (Fig. 4). During the analysis of the data (Table 2) presented in the SMPDB database, pathways were identified and sorted by levels of significance (analysis of pathway enrichment, ordinate axis in Fig. 4) and the values of the influence of the metabolites under consideration on the pathway (analysis of the topology of the pathway, abscissa axis in Fig. 4). Fig. 4). The color of the node corresponds to the level of significance, and the radius of the node correlates with the amount of influence on the path. The pathway impact was calculated as the sum of the significance scores of the relevant metabolites normalized to the sum of the significance scores of all metabolites in each pathway. Metabolic pathway enrichment was assessed by over-representation analysis (ORA) using a hypergeometric test.
Discussion
Our study showed that the patient's clinical and anamnestic data make a significant contribution to the multivariate calculation of the risk of developing preeclampsia and also confirmed that starting to take acetylsalicylic acid earlier significantly reduces preeclampsia [7]. Of the greatest interest were the results of the search for metabolites responsible for the occurrence of preeclampsia in high-risk patients. The levels of tryptophan (p=0.05) and 3-hydroxy-3-methylglutaric acid (p=0.05) in samples collected at 11–14 weeks of gestation as well as taurine (p=0.05) at 22–25 weeks of gestation.
The amino acid levels in the mother's body play a key role in the regulation of fetal growth [8]. However, data on amino acid levels during pregnancy are rather limited and come from small sample size studies [9, 10]. Therefore, additional information regarding possible disturbances in amino acid metabolism in preeclampsia may play an important role in understanding the pathogenesis of preeclampsia. The metabolism of leucine, valine, and isoleucine has previously been shown [11] to be associated with various hypertensive disorders, including preeclampsia. Hydroxyglutamate is considered as a significant predictor of preeclampsia [12]. It is involved in the arginine-proline metabolism pathway, the disruption of which is also associated with hypertensive disorders [13]. In addition, hydroxyglutamate is a substrate in the reaction that produces 4-hydroxy-2-oxoglutarate as an intermediate in several pathways associated with preeclampsia [13].
Among the other metabolites considered in this study, lactate is of particular interest because its levels differed significantly among the three study groups. Lactate is formed from pyruvate by lactate dehydrogenase (LDH) during the last stage of glycolysis and acts as a substrate for gluconeogenesis. Lactate is produced in the majority of tissues. The circulating lactate concentration is <2 mmol/L, and under normal aerobic conditions, lactate is constantly produced and consumed [14, 15]. Under hypoxic conditions or when the rate of cellular glycolysis is exceeded, pyruvate is converted to lactate with the formation of adenosine triphosphate. Factors contributing to increased lactate levels include hypoperfusion, mitochondrial dysfunction, and hypermetabolic state [16]. Lactate is metabolized in the liver, accounting for up to 70% of lactate clearance, and in kidneys [17]. Under normal conditions, the formation and consumption of lactate are the same, leading to a stable blood lactate concentration [17]. LDH is reported to have increased activity and gene expression in the placenta during preeclampsia, and lactate is produced and secreted at higher concentrations [18, 19]. However, in the present study, urinary lactate levels were lower in patients at risk of preeclampsia and patients with manifestation of preeclampsia than in those with healthy pregnancies. This may be due to the peculiarities of kidney function in patients at risk of preeclampsia without clinical manifestations of preeclampsia and in patients with preeclampsia.
It is worth noting that this is the first study in which a group of patients with a high risk of preeclampsia, according to the first-trimester screening, was divided into two subgroups: those in whom preeclampsia did not manifest and those in whom the risk of preeclampsia was clinically realized. The results indicated different dynamic changes in metabolism among the studied groups, which may explain the risk of developing preeclampsia, for example, at 22–25 weeks of gestation. Despite the high predictive power of screening in the first trimester [20], additional examination of the metabolomic profile of urine in women at high risk in later gestation is needed to accurately predict preeclampsia.
The strength of this study is that it was a dynamic comparative study of the urinary metabolomic profile in uncomplicated pregnancies, high-risk patients without preeclampsia, and high-risk patients with clinical preeclampsia.
The weakness of this study lies in the small sample size, which is associated with the frequency of preeclampsia and the difficulty of taking material at the appropriate time of pregnancy in outpatient settings. Further studies with larger sample sizes will help to test the reliability of methods based on the analysis of the dynamics of changes in the urine metabolome to determine the feasibility of using metabolomics to predict and diagnose preeclampsia.
Conclusion
During the study, statistically significant differences in the levels of metabolites in urine were observed between the group of patients with a normal course of pregnancy and those at risk of developing preeclampsia at different gestational ages. Metabolites that contribute to the differentiation of urine samples from patients who develop preeclampsia and those at risk of developing preeclampsia are involved in various metabolic pathways related to fetal growth regulation, hypertensive disorders, hypoxia, and mitochondrial function. Further research using larger datasets is necessary to validate these results. However, profiling urinary metabolites shows promise as a method of predicting preeclampsia.
Metabolomic analysis of urine has the potential to elucidate the role of individual metabolites in the pathogenesis of preeclampsia and to identify specific metabolite biomarkers for different stages of pregnancy. This can be helpful for the comprehensive monitoring of preeclampsia, assessing treatment effectiveness, and optimizing delivery timing. Further exploration and validation of these findings are warranted.
References
- Uzan J., Carbonnel M., Piconne O., Asmar R., Ayoubi J.M. Pre-eclampsia: Pathophysiology, diagnosis, and management. Vasc. Health Risk Manag. 2011; 7: 467-74. https://dx.doi.org/10.2147/VHRM.S2018.
- Turner E., Brewster J.A., Simpson N.A.B., Walker J.J., Fisher J. Plasma from women with preeclampsia has a low lipid and ketone body content - a nuclear magnetic resonance study. Hypertens Pregnancy. 2007; 26(3): 329-42.https://dx.doi.org/10.1080/10641950701436073.
- Turner E., Brewster J.A., Simpson N.A.B.., Walker J.J., Fisher J. Aromatic amino acid biomarkers of preeclampsia - A nuclear magnetic resonance investigation. Hypertens Pregnancy. 2008; 27(3): 225-35.https://dx.doi.org/10.1080/10641950801955725.
- Министерство здравоохранения Российской Федерации. Клинические рекомендации. Преэклампсия. Эклампсия. Отеки, протеинурия и гипертензивные расстройцства во время беременности. 2021. [Ministry of Health of the Russian Federation. Clinical guidelines. Preeclampsia. Eclampsia. Edema, proteinuria, and hypertensive disorders during pregnancy. 2021.(in Russian)].
- Wold S., Sjöström M., Eriksson L. PLS-regression: a basic tool of chemometrics. Chemom. Intell. Lab. Syst. 2001; 58(2): 109-30.
- Thevenot E.A., Roux A., Xu Y., Ezan E., Junot C. Analysis of the human adult urinary metabolome variations with age, body mass index, and gender by implementing a comprehensive workflow for univariate and OPLS statistical analyses. J. Proteome Res. 2015; 14(8): 3322-35. https://dx.doi.org/10.1021/acs.jproteome.5b00354.
- Rolnik D., Nicolaides K., Poon L. Prevention of preeclampsia with aspirin. Am. J. Obstet. Gynecol. 2022; 226(Suppl. 2): S1108-19. https://dx.doi.org/10.1016/j.ajog.2020.08.045.
- Liu L.X., Arany Z. Maternal cardiac metabolism in pregnancy. Cardiovasc. Res. 2014; 101(4): 545-53. https://dx.doi.org/10.1093/cvr/cvu009.
- Rossary A., Farges M.C., Lamas B., Miles E.A., Noakes P.S., Kremmyda L.S. et al. Increased consumption of salmon during pregnancy partly prevents the decline of some plasma essential amino acid concentrations in pregnant women. Clin. Nutr. 2014; 33(2): 267-73. https://dx.doi.org/10.1016/j.clnu.2013.04.013.
- Cetin I., Nobile De Santis M.S., Taricco E., Radaelli T., Teng C., Ronzoni S. et al. Maternal and fetal amino acid concentrations in normal pregnancies and in pregnancies with gestational diabetes mellitus. Am. J. Obstet. Gynecol. 2005; 192(2): 610-7. https://dx.doi.org/10.1016/j.ajog.2004.08.011.
- Bahado-Singh R.O., Syngelaki A., Mandal R., Graham S.F., Akolekar R., Han B. et al. Metabolomic determination of pathogenesis of late-onset preeclampsia. J. Matern. Neonatal Med. 2017; 30(6): 658-64. https://dx.doi.org/10.1080/14767058.2016.1185411.
- Sovio U., McBride N., Wood A.M., Masconi K.L., Cook E., Gaccioli F. et al. 4-Hydroxyglutamate is a novel predictor of pre-eclampsia. Int. J. Epidemiol. 2020; 49(1): 301-11. https://dx.doi.org/10.1093/ije/dyz098.
- Harville E.W., Li Y.Y., Pan K., McRitchie S., Pathmasiri W., Sumner S. Untargeted analysis of first trimester serum to reveal biomarkers of pregnancy complications: a case–control discovery phase study. Sci. Rep. 2021; 11(1): 3468. https://dx.doi.org/10.1038/s41598-021-82804-1.
- Okorie O.N., Dellinger P. Lactate: Bbiomarker and potential therapeutic target. Crit. Care Clin. 2011; 27(2): 299-326. https://dx.doi.org/10.1016/j.ccc.2010.12.013.
- Peguero A., Parra R.A., Carrillo S.P., Rojas-Suarez J., Figueras F. Association of plasma lactate concentration at admission of severe preeclampsia to maternal complications. Pregnancy Hypertens. 2019; 17: 89-93.https://dx.doi.org/10.1016/j.preghy.2019.05.003.
- Andersen L.W., Mackenhauer J., Roberts J.C., Berg K.M., Cocchi M.N., Donnino M.W. Etiology and therapeutic approach to elevated lactate levels. Mayo Clin. Proc. 2013; 88(10): 1127-40. https://dx.doi.org/10.1016/j.mayocp.2013.06.012.
- Kraut J.A., Madias N.E. Lactic acidosis. N. Engl. J. Med. 2014; 371(24): 2309-19. https://dx.doi.org/10.1056/NEJMra1309483.
- Kay H.H., Zhu S., Tsoi S. Hypoxia and lactate production in trophoblast cells. Placenta. 2007; 28(8-9): 854-60. https://dx.doi.org/10.1016/j.placenta.2006.11.011.
- Settle P., Mynett K., Speake P., Champion E., Doughty I.M., Sibley C.P. et al. Polarized lactate transporter activity and expression in the syncytiotrophoblast of the term human placenta. Placenta. 2004; 25(6): 496-504.https://dx.doi.org/10.1016/j.placenta.2003.11.009.
- Rolnik D., Wright D., Poon L., Syngelaki A., O'Gorman N. ASPRE trial: performance of screening for preterm pre-eclampsia. Ultrasound Obstet. Gynecol. 2017; 50(4): 492-5. https://dx.doi.org/10.1002/uog.18816.
Received 20.02.2023
Accepted 25.07.2023
About the Authors
Madina S. Оshkhunova, PhD Student at the High-risk Pregnancy Department, Academician V.I. Kulakov National Medical Research Center for Obstetrics, Gynecology and Perinatology, Ministry of Health of Russia, +7(495)438-06-74, madina.oshkhunova@mail.ru, https://orcid.org/0000-0002-7044-7962,117997, Russia, Moscow, Akademika Oparina str., 4.
Vitaliy V. Chagovets, PhD, Head of the Laboratory of Metabolomics and Bioinformatics, Academician V.I. Kulakov National Medical Research Center for Obstetrics, Gynecology and Perinatology, Ministry of Health of Russia, +7(495)438-21-98, vvchagovets@gmail.com, https://orcid.org/0000-0003-2708-4366,
117997, Russia, Moscow, Akademika Oparina str., 4.
Anastasia V. Novoselova, Researcher at the Laboratory of Metabolomics and Bioinformatics, Academician V.I. Kulakov National Medical Research Center for Obstetrics, Gynecology and Perinatology, Ministry of Health of Russia, +7(495)438-21-98, a_novoselova@oparina4.ru, https://orcid.org/0000-0002-2619-139X,
117997, Russia, Moscow, Akademika Oparina str., 4.
Kamilla T. Muminova, PhD, Researcher at the High Risk Pregnancy Department, Academician V.I. Kulakov National Medical Research Center for Obstetrics, Gynecology and Perinatology, Ministry of Health of Russia, +7(916)373-77-07, kamika91@mail.ru, https://orcid.org/0000-0002-5120-376X, 117997, Russia, Moscow, Akademika Oparina str., 4.
Ksenia A. Gorina, PhD, Researcher at the High Risk Pregnancy Department, Academician V.I. Kulakov National Medical Research Center for Obstetrics, Gynecology and Perinatology, Ministry of Health of Russia, +7(916)373-77-07, k_gorina@oparina4.ru, https://orcid.org/0000-0003-2708-4366,
117997, Russia, Moscow, Akademika Oparina str., 4.
Zulfia S. Khodzhaeva, Dr. Med. Sci., Professor, Deputy Director of Obstetrics Institute, Academician V.I. Kulakov National Medical Research Center for Obstetrics, Gynecology and Perinatology, Ministry of Health of Russia, +7(916)407-75-67, zkhodjaeva@mail.ru, https://orcid.org/0000-0001-8159-3714,
117997, Russia, Moscow, Akademika Oparina str., 4.
Vladimir E. Frankevich, Dr. Sci. (Physics and Mathematics), Head of the Department of Proteomics of Human Reproduction Department, Academician V.I. Kulakov National Medical Research Center for Obstetrics, Gynecology and Perinatology, Ministry of Health of Russia, +7(495)438-21-98, v_frankevich@oparina4.ru,
https://orcid.org/0000-0002-9780-4579, 117997, Russia, Moscow, Akademika Oparina str., 4.
Similar Articles