Body mass index, body composition, and metabolic profile of patients with polycystic ovary syndrome
Objective: To compare the diagnostic value of body mass index (BMI), body composition, and their relationship with the metabolic profile of patients with polycystic ovary syndrome (PCOS).Chernukha G.E., Miroshina E.D., Kuznetsov S.Yu., Ivanov I.A.
Materials and methods: A single-center, cross-sectional study included 129 women with PCOS (mean age 26.7 (5.4) years). They underwent a comprehensive clinical and laboratory examination, including BMI calculation, body composition analysis, hormonal and lipid profiles, glucose metabolism, and pelvic ultrasound.
Results: Among patients with PCOS, overweight and obesity were diagnosed only in 48/129 (37.2%) patients, and 95/129 (73.6%) had an excess of total adipose tissue located mainly in the visceral region. Forty-six of 81 (56.8%) patients with normal BMI values had an excess of total adipose tissue, indicating latent obesity. Among them, 18/46 (39.1%) had visceral obesity, which was associated with hyperinsulinemia, insulin resistance (IR), and dyslipidemia in every third case and with impaired glucose tolerance (IGT) in every 5th case. ROC analysis showed that at a threshold value of BMI≥23 kg/m2, an excess of total adipose tissue was detected in 100% of cases, NTG was more than 11 times more common, and hyperinsulinemia and dyslipidemia were three times more common. In patients with PCOS, a BMI≥23 kg/m2 can be considered a factor predisposing to the development of IR with a sensitivity of 74% and a specificity of 70%.
Conclusion: It would be appropriate to include body composition analysis in the diagnostic evaluation of patients with PCOS to identify excess adipose tissue associated with metabolic disorders. BMI≥23 kg/m2 can be considered a clinical marker of excess adipose tissue and a high risk of developing metabolic disorders. With their early diagnosis, effective interventions can be selected, including lifestyle modification and pharmacotherapy to reduce the risk of type 2 diabetes and cardiovascular diseases in the long term.
Keywords
polycystic ovary syndrome
BMI
dual-energy X-ray absorptiometry
body composition
visceral obesity
metabolic profile
insulin resistance
Polycystic ovary syndrome (PCOS) is the most common endocrine disorder affecting reproductive-aged women, with a prevalence of between 6 to 19.9%. Besides oligo-ovulation or anovulation, clinical or biochemical evidence of hyperandrogenism, and polycystic ovarian morphology, every 2–3rd patient has metabolic disorders aggravated by overweight and obesity [1, 2]. Several studies have demonstrated an increased incidence of metabolic dysfunction in non-obese PCOS patients [1, 3, 4]. A 2010 meta-analysis provides evidence of a threefold higher risk of impaired glucose tolerance (IGT) and metabolic syndrome in PCOS patients with normal body mass index (BMI) compared with healthy women. [1] Similar data were presented in the 2019 meta-analysis, indicating a significant increase in the risk of hyperinsulinemia and insulin resistance (IR) [5]. At the same time, in several other studies, no significant differences were found in the incidence of IGT and type 2 diabetes mellitus between PCOS patients with normal body weight and healthy women [6, 7].
In recent years, the clinical value of BMI has been the subject of considerable attention in the literature. The American Association of Clinical Endocrinologists proposed not to consider BMI as a critical criterion for obesity, which can be diagnosed even with a BMI of 25 kg/m2 and the presence of at least one complication, disease, or associated condition [8].
It is also worth noting that BMI is a simple equation based on height and body weight, including adipose, muscle, bone tissue, and body water [9]. Research evidence suggests that BMI is not informative enough to assess adipose tissue excess or deficiency, which is closely related to the level of sex steroid hormones [10, 11]. Patients with a normal BMI may have IGT, IR, and hyperinsulinemia, suggesting metabolically obese normal weight [12]. There is a relationship between excess adipose tissue, especially abdominal adiposity, with the development of metabolic dysfunction [8, 13]. An informative, reasonably inexpensive, and straightforward method for measuring body composition in terms of fat and fat-free mass, is dual-energy X-ray absorptiometry (densitometry). However, at present, this method is not included in the algorithm for PCOS patient examination, which may lead to an underestimation of cardio-metabolic risks.
This study aimed to compare the diagnostic value of BMI, body composition, and their relationship with the hormonal and metabolic profile of patients with polycystic ovary syndrome (PCOS).
Materials and methods
This was a single-center, cross-sectional study. The inclusion criteria were age from 18 to 40, PCOS diagnosed according to the Rotterdam consensus criteria, and signed informed consent. The exclusion criteria were severe somatic comorbidities, systemic autoimmune diseases, hormone therapy less than three months before enrollment in the study.
The study was reviewed and approved by the Research Ethics Committee of the V.I. Kulakov NMRC for OG&P and conducted at the Department of Gynecological Endocrinology.
The study included 129 women with PCOS [mean age 26.7 (5.4) years] and mean BMI 23.8 (4.8) kg/m2. Among them, 29/129 (22.5%) were overweight (BMI 25–29.9 kg/m2), 19/129 (14.7%) were obese (BMI ≥30 kg/m2), including 15/19 (78.9%) grade I and 4/19 (21.1%) grade II obesity [14].
Clinical signs of hyperandrogenism in the form of hirsutism, acne, or alopecia were found in 78/129 (60.5%) patients, biochemical hyperandrogenism - in 99/129 (76.7%). All patients had cycle disorders: in 101/129 (78.3%) cases – oligomenorrhea, in 28/129 (21.7%) – primary or secondary amenorrhea.
All participants underwent a general clinical with the calculation of BMI (weight/height2). Densitometry was performed on a Lunar model 8743; GE Medical Systems (Madison, WI USA). The following parameters were analyzed: the percentage of total adipose tissue, the mass of the whole body, and trunk adipose tissue. The percentage of total adipose tissue ≥30 was interpreted as an excess of adipose tissue or "latent obesity" [15–18]. The CoreScan software was used to determine the volume and mass of visceral adipose tissue; its excess was diagnosed when the visceral adipose tissue mass exceeded 235 g [19].
The number of follicles and ovarian volume was determined by pelvic ultrasound on the 5–7th day of a spontaneous or progestogen-induced menstrual cycle on a 2000 Toshiba SSA-240 machine (Japan) with a 7.5 MHz transvaginal convex transducer.
On day 2–3 of the menstrual cycle, hormonal profile including serum anti-Müllerian hormone, luteinizing hormone, follicle-stimulating hormone, estradiol, total testosterone, and insulin was assessed in all patients using the electrochemiluminescence immunoassay on an automatic immunochemical analyzer Cobas e411 (Roche Diagnostics GmbH, Germany) using commercial kits from this manufacturer. Levels of androstenedione and globulin binding sex hormones were determined by the chemiluminescence immunoassay on an automatic immunochemical analyzer IMMULITE 2000 (Siemens, USA). Serum 17-OH-progesterone and free testosterone were determined by enzyme-linked immunosorbent assay using DRG 17-α-OH-Progesterone ELISA commercial kits (DRG Diagnostic, USA) and Free Testosterone ELISA (Diagnostics Biochem Inc., Canada).
Biochemical studies including serum glucose, total cholesterol, triglycerides, high-density lipoprotein cholesterol, and low-density lipoprotein cholesterol were performed by photometric and turbidimetric methods on automatic BA-400 analyzers (Biosystems, Spain). The atherogenic coefficient (CA) was calculated using the formula: CA = (cholesterol - high-density lipoproteins)/high-density lipoproteins. Carbohydrate metabolism disorders and hyperinsulinemia were diagnosed based on the results of a 75-g oral two-hour post-load glucose tolerance test. Fasting glucose and immunoreactive insulin levels were determined at 60 and 120 min time points of OGTT. An insulin sensitivity model (HOMA index) was calculated by the formula: fasting glucose (mmol/L) × fasting insulin (μU/ml)/22.5. The HOMA index greater than 2.7 was considered as a criterion for IR [20].
Statistical analysis
Statistical analysis was performed using the Statistical Package for the Social Sciences (SPSS) version 21 (IBM). The normality of the distribution was tested by the Shapiro–Wilk test. Quantitative variables showing normal distribution were expressed as means (M) and standard deviation (SD) and presented as M (SD); otherwise, the median (Me) with interquartile range (Q1; Q3) were reported. Differences in the mean values between groups were analyzed using ANOVA with pairwise comparisons using Student's t-test with Bonferroni correction. For non-normally-distributed parameters, the nonparametric Kruskal–Wallis test was used to compare numerical data between groups, followed by pairwise comparison using the Mann–Whitney U-test for unpaired samples. When several groups were compared, Bonferroni correction was applied for multiple comparisons. Equality of variance was assessed by Levene's test. Categorical variables were compared by the χ2 test with the Yates correction; Fisher's exact test was used for small samples. Correlation analysis was conducted by calculating Pearson's correlation coefficient for normally distributed variables and Spearman's rank correlation for non-normally distributed quantitative variables. A ROC analysis was performed to calculate the threshold level of variables, their specificity and sensitivity to identify the risk of metabolic disorders. The critical level of significance when the testing statistical hypothesis was considered at p=0.05.
Results
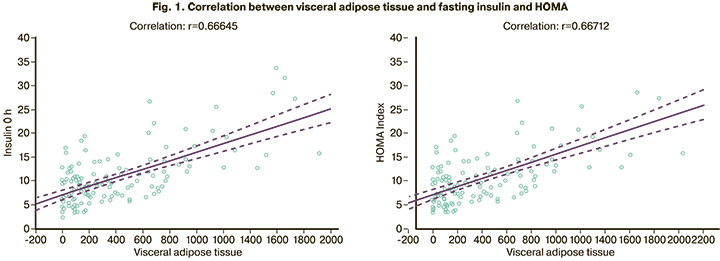
IGT was detected in 20/129 (15.5%) patients, IR and hyperinsulinemia in 45/129 (34.9%) and 44/129 (34.1%), respectively, dyslipidemia in 50/129 (38.8%). Densitometry showed an excess of total adipose tissue in 95/129 (73.6%) patients with a mean value of 35.4 (6.9%) and BMI of 23.8 (4.8) kg/m2. Of them, 65/95 (68.4%) had excess visceral adiposity with a median adipose tissue of 418.5 (199.5; 735.5) g. A direct relationship was established between the amount of visceral adipose tissue and all carbohydrate and lipid metabolism indicators. The highest correlation was observed with fasting insulin (r=0.666, 95% CI=0.557–0.752), p<0.01) and the HOMA (r=0.667, CI=0.559–0.753, p<0.01) (Fig. 1).
At the next stage, we compared metabolic parameters and body composition of patients with normal BMI, overweight and obesity. In the obese group, an increase in the IR index was present in 17/19 (89.5%) patients and hyperinsulinemia in 13/19 (68.4%). In the overweight group, these indicators were 10/29 (34.5%) (p<0.001) and 11/29 (37.9%) (p=0.039) and did not differ statistically significantly with patients with normal body weight [16/81 (19.8%) (p=0.110) and 19 / 81 (23.5%) (p=0.134)]. IGT was diagnosed in 8/19 (42.1%) patients with obesity, in 6/29 (20.7%) with overweight (p=0.111), and in 8/81 (9, 9%) with normal body weight (in comparison with overweight p=0.134). Dyslipidemia was observed in 11/19 (57.9%) obese patients, 13/29 (44.8%) overweight (p=0.376) and 21/81 (25.9%) patients with normal BMI (in comparison with overweight p=0.059).
All overweight and obese patients had an excess of total adipose tissue. Its average percentage in these groups was 40.5 (3.7) % and 45.1 (3.2)% (p<0.001). In the group with normal BMI, this indicator was 31.1 (4.6) %. At the same time, in some patients, it reached the level of 42.8%. This is higher than the average value in the overweight group (40.5%). This is quite natural since 46/81 (56.8%) patients with normal BMI were found to have latent obesity characterized by excess adipose tissue; in 18/46 (39.1%) cases, it was represented by an excess of visceral adipose tissue. Based on this, we analyzed the body composition and metabolic profile of patients with normal BMI who had and did not have latent obesity (Table 1).
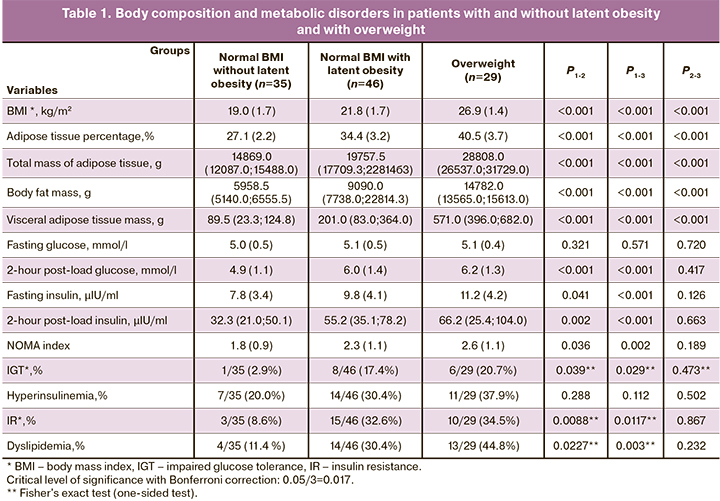
In patients with latent obesity, the mean BMI and the percentage of total adipose tissue were statistically significantly higher than in patients without it (p<0.001). Patients with latent obesity had a 3-fold higher visceral adipose tissue mass and a 2-fold higher mass of trunk adipose tissue than women without latent obesity. As shown in Table 1, the groups were similar regarding the mean level of fasting glucose, but insulin concentrations were higher in patients with latent obesity. The incidence of metabolic disorders was also several times higher in the latent obesity group. Body composition parameters of patients with latent obesity were lower than those of overweight. However, no significant differences were found between the groups in the incidence of metabolic disorders. Every third patient had hyperinsulinemia and IR, and every fifth had IGT.
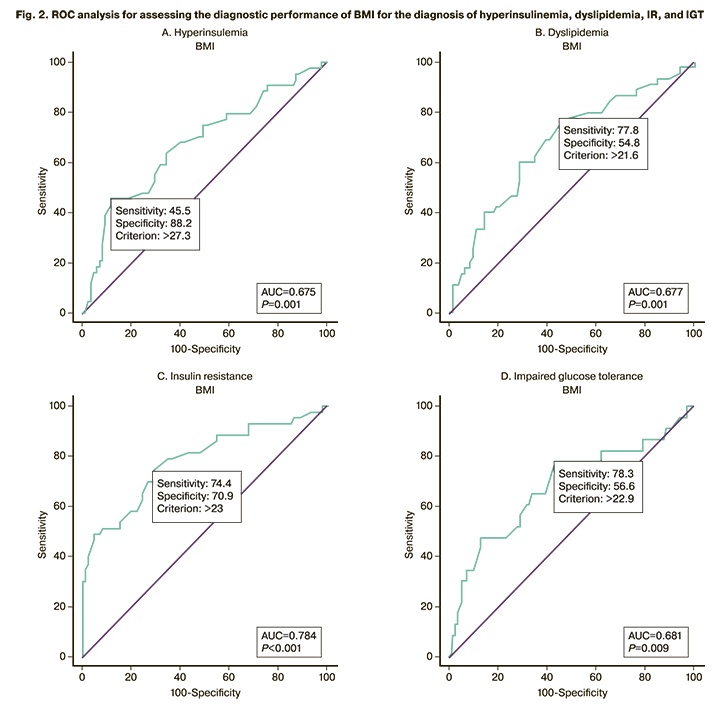
Considering the limited availability of the densitometry devices with software for assessing body composition and visceral adiposity in everyday clinical practice, it was decided to determine the threshold of BMI to identify the risk of metabolic disorders and excess adipose tissue. ROC analysis was performed to determine the risk of IGT, IR, hyperinsulinemia, and dyslipidemia, which showed the largest area under the curve for detecting IR by BMI (AUC=0.784 (0.046)). The threshold of BMI in the ROC analysis was 23 kg/m2 with a sensitivity of 74.07% (95% CI=63.60–82.37) and a specificity of 70.0% (95% CI=56.25–80.90). The predictive positive and negative values were 80.0% (95% CI=69.59–87.49) and 62.5% (95% CI=49.41–73.99), respectively. The diagnostic accuracy was 72.52% (95% CI=62.80–80.49) (Fig. 2).
Subsequently, the patients were divided into 2 subgroups categorized by BMI values of BMI < 23 kg/m2 (subgroup 1) and BMI from 23 to 24.9 kg/m2 (subgroup 2). The metabolic profile of the patients in subgroup 1 was statistically significantly different from that in subgroup 2 in the incidence of IGT, hyperinsulinemia, and IR, which indicates the significance of the BMI cut-off threshold of 23 kg/m2 in assessing the risk of metabolic disorders (Table 2).
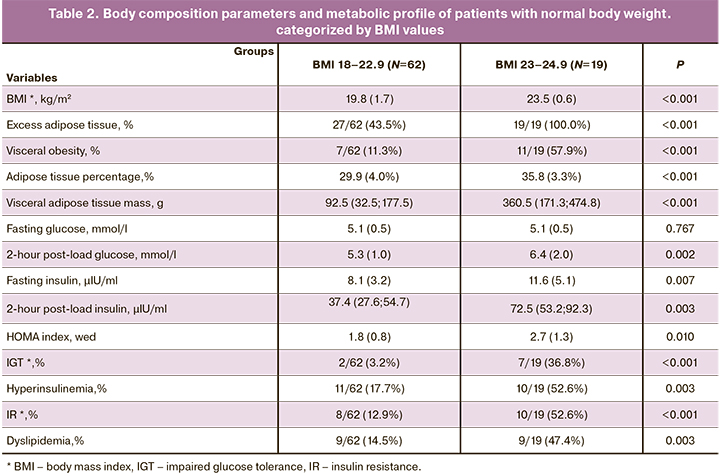
Excess adipose tissue was found in 19/19 (100%) patients with a BMI>23 kg/m2 and in 27/62 (43.5%) with BMI<23 kg/m2. Visceral obesity was diagnosed in 7/62 (11.3%) patients subgroup 1 and in 11/19 (57.9%) patients in subgroup 2. IGT was observed only in 2/62 (3.2%) of patients with BMI<23 kg/m2 and in 7/19 (36.8%) with BMI ≥23 kg/m2, i.e., 11.5 times more often. Compared with subgroup 1, patients in subgroup 2 had more than 11 times higher the risk of developing IGT [RR=11.42 (CI=2.59–50.43)], 4 times higher risk of IR [RR=4.08 (CI=1.88–8.85)], 3 times higher risk of dyslipidemia and hyperinsulinemia [RR=3.26 (CI=1.51–7.03) and RR=2.97 (CI=1.5–5.88), respectively]. This indicates the significance of the new BMI cut-off threshold.
Discussion
PCOS is the most common cause of endocrine infertility, clinical hyperandrogenism, and a metabolic reproductive syndrome requiring assessment of BMI and lipid and carbohydrate metabolism. It is well known that PCOS is often associated with IRR, hyperinsulinemia, and an increased risk of IGT and type 2 diabetes mellitus [21, 22]. In this study, every third patient was found to have IR, hyperinsulinemia, and dyslipidemia, which is consistent with the literature reporting similar rates of obesity in these patients [23].
The current literature lacks information related to the assessment of the body composition of patients with PCOS. Available studies reported various methods (ultrasound, bioimpedance analysis, MRI, densitometry), which was reflected in the ambiguity of the results. Some studies indicate an increase in the percentage of total adipose tissue, the amount of adipose tissue in the abdominal region, or an increase in the trunk-to-leg fat ratio in patients with PCOS compared with the control group [24–28]. However, there is a study in which densitometry did not reveal differences in body composition [29].
In our study, overweight and obesity determined by BMI were observed only in 48/129 (37.2%) patients. In comparison, an excess of total adipose tissue by densitometry was diagnosed two times more often [95/129 (73.6%)] patients, of which 65/95 (68.4%) had visceral obesity. This indicates that the BMI does not sufficiently reflect the excess adipose tissue, which causes various metabolic disorders.
The study of the metabolic status of the patients showed that patients with a BMI <25 kg/m2 had a high incidence of metabolic disorders. The rates of IR and hyperinsulinemia with normal BMI were 16/81 (19.8%) and 19/81 (23.5%) and did not differ from those in the overweight group [(10/29 (34.5%), p=0.110 and 11/29 (37.9%,), p = 0.134)]. IGT incidence also did not differ significantly between normal and overweight [(8/81 (9.9%) and 6/29 (20.7%), respectively, p=0.134)].
It is known that the leading risk factor for the development of IR is an excess of adipose tissue, which can also be observed at normal body weight [30, 31]. In 1981, Ruderman et al. identified a cohort of patients with metabolic disorders at normal BMI and proposed the term "metabolically obese normal weight" [12]. To date, there are no diagnostic criteria for this condition; most of these patients have IR and excess adipose tissue [30].
Densitometry findings showed that 46/81 (56.8%) patients with normal BMI had an excess of total adipose tissue. The mean percentage of total adipose tissue was 35.4 (6.9)%, lower than in the study by Hestiantoro A. et al., where it reached 39.38%. However, it should be noted that this study included patients with a higher BMI [(29.1 (5.1) kg/m2 vs. 23.8 (4.8) kg/m2)] [32]. Our results are consistent with other studies, reporting that the amount of adipose tissue in patients with PCOS is more significant than among healthy women with the same anthropometric parameters [33, 34]. However, in a study by Carmina et al., no increase in total adipose tissue was found in PCOS patients with normal body weight. In contrast, they had excess trunk adipose tissue associated with IR in 30% of cases [27]. Similarly, in the present study, in patients with latent obesity, IR was detected in 15/46 (32.6%) cases, IGT in 8/46 (17.4%) hyperinsulinemia and dyslipidemia in 14/46 (30, 4%), which indicates an adverse effect of excess adipose tissue on the metabolic profile. It should be noted that these indicators did not significantly differ from those in patients with overweight. In contrast, in the absence of latent obesity, IGT was detected only in 1 out of 35 (2.9%) of them, and IR and dyslipidemia occurred 3–4 times less often. This confirms the importance of ATV in comparison with BMI for the diagnosis of metabolic disorders. At the same time, the clinical guidelines for PCOS indicate the need for an oral glucose tolerance test and assessment of the lipid profile only in patients with a BMI ≥25 kg/m2 [35]. The presence of metabolic disorders in every third patient with latent obesity gives grounds for discussion and possible revision of this position to identify these conditions timely.
Considering the limited availability of densitometry in everyday clinical practice, we determined the BMI threshold to identify excess adipose tissue and metabolic disorders. All patients with a BMI> 23 kg/m2 had an excess of ATV. Hyperinsulinemia and dyslipidemia occurred three times, IR 4 times, and IGT 11 times more often than those with BMI ≤23 kg/m2. Therefore, a BMI of 23 kg/m2 can be considered a threshold for identifying excess adipose tissue and the risk of developing metabolic disorders in patients with PCOS.
Conclusion
Every second PCOS patient with a BMI<25 kg/m2 has an unfavorable metabolic phenotype characterized by an excess of adipose tissue, located mainly in the visceral region, which in every 3 cases is associated with IR, hyperinsulinemia, dyslipidemia, and in about every fifth with IGT. These observations warrant the inclusion of densitometry for assessing body composition and diagnosis of visceral obesity in the algorithm for examining patients with PCOS. Without such an opportunity, BMI≥23 kg/m2 can be considered a clinical marker of excess adipose tissue and a high risk of developing metabolic disorders. With their early diagnosis, effective interventions can be selected, including lifestyle modification and pharmacotherapy to reduce the risk of type 2 diabetes and cardiovascular diseases in the long term.
References
- Moran L.J., Misso M.L., Wild R.A., Norman R.J. Impaired glucose tolerance, type 2 diabetes and metabolic syndrome in polycystic ovary syndrome: a systematic review and meta-analysis. Hum Reprod Update. 2010; 16(4): 347-63. https://dx.doi.org/10.1093/humupd/dmq001.
- Cooney L.G., Lee I., Sammel M.D., Dokras A. High prevalence of moderate and severe depressive and anxiety symptoms in polycystic ovary syndrome: a systematic review and meta-analysis. Hum Reprod. 2017; 32(5): 1075-91. https://dx.doi.org/10.1093/humrep/dex044.
- Attaoua R., El Mkadem S.A., Radian S., Fica S., Hanzu F., Albu A. et al. FTO gene associates to metabolic syndrome in women with polycystic ovary syndrome. Biochem Biophys Res Commun. 2008; 373(2): 230-4. https://dx.doi.org/10.1016/j.bbrc.2008.06.039.
- Morgan C.L., Jenkins-Jones S., Currie C.J., Rees D.A. Evaluation of adverse outcome in young women with polycystic ovary syndrome versus matched, reference controls: a retrospective, observational study. J Clin Endocrinol Metab. 2012; 97(9): 3251-60. https://dx.doi.org/10.1210/jc.2012-1690.
- Zhu S., Zhang B., Jiang X., Li Z., Zhao S., Cui L. et al. Metabolic disturbances in non-obese women with polycystic ovary syndrome: a systematic review and meta-analysis. Fertil Steril. 2019; 111(1): 168-77. https://dx.doi.org/10.1016/j.fertnstert.2018.09.013.
- Vrbikova J., Fanta M., Cibula D., Vondra K, Bendlova B. Impaired glucose metabolism in women with polycystic ovary syndrome. Gynecol Obstet Invest. 2009; 68(3): 186-90. https://dx.doi.org/10.1159/000232574.
- Ollila M.-M.., West S., Keinaanen-Kiukaanniemi S., Jokelainen J., Auvinen J., Puukka K. et al. Overweight and obese but not normal weight women with PCOS are at increased risk of Type 2 diabetes mellitus – a prospective, population-based cohort study. Hum Reprod. 2017; 32(2): 423-31. https://dx.doi.org/10.1093/humrep/dew329.
- Garvey W.T., Garber A.J., Mechanick J.I., Bray G.A., Dagogo-Jack S., Einhorn D. et al. The Aace Obesity Scientific Committee. American association of clinical endocrinologists and american college of endocrinology position statement on the 2014 advanced framework for a new diagnosis of obesity as a chronic disease. Endocr Pract. 2014; 20(9): 977-89. https://dx.doi.org/10.4158/EP14280.PS.
- Dickey R.A., Bartuska D.G., Bray G.W., Callaway C.W., Davidson E.T., Feld S. et al. AACE/ACE Position statement on the prevention, diagnosis, and treatment of obesity (1998 revision). Endocr Pract. 1998; 4: 297-350.
- Чернуха Г.Е., Табеева Г.И., Гусев Д.В., Кузнецов С.Ю. Оценка показателей жировой ткани при функциональной гипоталамической аменорее. Акушерство и гинекология. 2018; 2: 74-80. [Chernukha G.E., Tabeeva G.I., Gusev D.V., Kuznetsov S.Yu. Estimation of adipose tissue indicators in functional hypothalamic amenorrhea. Akusherstvo i Ginekologiya/Obstetrics and Gynecology. 2018; (2): 74-80. (in Russian)]. https://dx.doi.org/10.18565/aig.2018.2.74-80.
- Kim J.Y., Han S.H., Yang B.M. Implication of high-body-fat percentage on cardiometabolic risk in middle-aged, healthy, normal-weight adults. Obesity (Silver Spring). 2013; 21(8): 1571-7. https://dx.doi.org/10.1002/oby.20020.
- Ruderman N.B., Schneider S.H., Berchtold P. The ‘metabolically-obese,’ normal-weight individual. Am J Clin Nutr. 1981; 34(8): 1617-21. https://dx.doi.org/10.1093/ajcn/34.8.1617.
- Fan B., Shepherd J.A., Levine M.A., Steinberg D., Wacker W., Barden H.S. et al. National Health and Nutrition Examination Survey whole-body dual-energy X-ray absorptiometry reference data for GE Lunar systems. J Clin Densitom. 2014; 17(3): 344-77. https://dx.doi.org/10.1016/j.jocd.2013.08.019.
- World Health Organization. Obesity: preventing and managing the global epidemic. Report of a WHO Consultation on Obesity, Geneva, 3–5 June 1997. Geneva: WHO; 1998.
- Sim S.J., Park H.S. The cut-off values of body fat to identify cardiovascular risk among Korean adults. Korean J Obes. 2004; 13(1): 14-21.
- Cho Y.G., Song H.J., Kim J.M., Park K.H., Paek Y.J., Cho J.J. et al. The estimation of cardiovascular risk factors by body mass index and body fat percentage in Korean male adults. Metabolism. 2009; 58(6): 765-71. https://dx.doi.org/10.1016/j.metabol.2009.01.004.
- Dudeja V., Misra A., Pandey R.M., Devina G., Kumar G., Vikram N.K. BMI does not accurately predict overweight in Asian Indians in northern India. Br J Nutr. 2001; 86(1): 105-12. https://dx.doi.org/10.1079/bjn2001382.
- Goh V.H., Tain C.F., Tong T.Y., Mok H.P., Wong M.T. Are BMI and other anthropometric measures appropriate as indices for obesity? A study in an Asian population. J Lipid Res. 2004; 45(10): 1892-8. https://dx.doi.org/10.1194/jlr.M400159-JLR200.
- Miazgowski T., Krzyżanowska-Świniarska B., Dziwura-Ogonowska J., Widecka K. The associations between cardiometabolic risk factors and visceral fat measured by a new dual-energy X-ray absorptiometry-derived method in lean healthy Caucasian women. Endocrine. 2014; 47(2): 500-5. https://dx.doi.org/10.1007/s12020-014-0180-7.
- Sumner A.E., Cowie C.C. Ethnic differences in the ability of triglyceride levels to identify insulin resistance. Atherosclerosis. 2008; 196(2): 696-703. https://dx.doi.org/10.1016/j.atherosclerosis.2006.12.018.
- Randeva H.S., Tan B.K., Weickert M.O., Lois K., Nestler J.E., Sattar N. et al. Cardiometabolic aspects of the polycystic ovary syndrome. Endocr Rev. 2012; 33(5): 812-41. https://dx.doi.org/10.1210/er.2012-1003.
- Чернуха Г.Е., Блинова И.В., Купрашвили М.И. Эндокринно-метаболические характеристики больных с различными фенотипами синдрома поликистозных яичников. Акушерство и гинекология. 2011; 2: 70-6. [Chernukha G.E., Blinova I.V., Kuprashvili M.I. Endocrine and metabolic characteristics of patients with different phenotypes of polycystic ovary syndrome. Obstetrics and gynecology. 2011; 2: 70-6 (in Russian)].
- Чернуха Г.Е., Блинова И.В. СПКЯ. Кардиоваскулярные риски и влияние на них терапии сиофором. Трудный пациент. 2008; 6(1): 18-22. [Chernukha, G.E., Blinova I.V. PCOS. Cardiovascular risks and the effect of Siofor therapy. Trudnyj pacient/Difficult patient. 2008; 6(1): 18-22 (in Russian)].
- Kirchengast S., Huber J. Body composition characteristics and fat distribution patterns in young infertile women. Fertil Steril. 2004; 81(3): 539-44. https://dx.doi.org/10.1016/j.fertnstert.2003.08.018.
- Yildrim B., Sabir N., Kaleli B. Relation of intra-abdominal fat distribution to metabolic disorders in nonobese patients with polycystic ovary syndrome. Fertil Steril. 2003; 79(6): 1358-64. https://dx.doi.org/10.1016/s0015-0282(03)00265-6.
- Yucel A., Noyan V., Sagsoz N. The association of serum androgens and insulin resistance with fat distribution in polycystic ovary syndrome. Eur J Obstet Gynecol Reprod Biol. 2006; 126(1): 81-6. https://dx.doi.org/10.1016/j.ejogrb.2005.11.012.
- Carmina E., Bucchieri S., Esposito A., Del Puente A., Mansueto P., Orio F. et al. Abdominal fat quantity and distribution in women with polycystic ovary syndrome and extent of its relation to insulin resistance. J Clin Endocrinol Metab. 2007; 92(7): 2500-5. https://dx.doi.org/10.1210/jc.2006-2725.
- Puder J.J., Varga S., Kraenzlin M., De Geyter C., Keller U., Muller B. Central fat excess in polycystic ovary syndrome: relation to low grade inflammation and insulin resistance. J Clin Endocrinol Metab. 2005; 90(11): 6014-21. https://dx.doi.org/10.1210/jc.2005-1002.
- Faloia E., Canibus P., Gatti C., Frezza F., Santangelo M., Garrappa G.G. et al. Body composition, fat distribution and metabolic characteristics in lean and obese women with polycystic ovary syndrome. J Endocrinol Invest. 2004; 27(5): 424-9. https://dx.doi.org/10.1007/BF03345285.
- Samuel V.T., Shulman G.I. The pathogenesis of insulin resistance: integrating signaling pathways and substrate flux. J Clin Invest. 2016; 126(1): 12-22. https://dx.doi.org/10.1172/JCI77812.
- Ding C., Chan Z., Magkos F. Lean, but not healthy: the 'metabolically obese, normal-weight' phenotype. Curr Opin Clin Nutr Metab Care. 2016; 19(6): 408-17. https://dx.doi.org/10.1097/MCO.0000000000000317.
- Hestiantoro A., Kapnosa Hasani R.D., Shadrina A., Situmorang H., Ilma N., Muharam R. et al. Body fat percentage is a better marker than body mass index for determining inflammation status in polycystic ovary syndrome. Int J Reprod Biomed. 2018; 16(10): 623-8.
- Rojas J., Chávez M., Olivar L., Rojas M., Morillo J., Mejías J. et al. Polycystic ovary syndrome, insulin resistance, and obesity: navigating the pathophysiologic labyrinth. Int J Reprod Med. 2014; 2014: 719050. https://dx.doi.org/10.1155/2014/719050.
- Lim S.S., Davies M.J., Norman R.J., Moran L.J. Overweight, obesity and central obesity in women with polycystic ovary syndrome: a systematic review and meta-analysis. Hum Reprod Update. 2012; 18(6): 618-37. https://dx.doi.org/10.1093/humupd/dms030.
- International Evidence-Based Guideline for the Assessment and Management of Polycystic Ovary Syndrome. 2018. Available at: https://www.monash.edu/medicine/sphpm/mchri/pcos/guideline Accessed 14 June 2019.
Received 16.07.2021
Accepted 14.09.2021
About the Authors
Galina E. Chernukha, Dr.Med.Sci., Professor, Head of the Department of Gynecologic Endocrinology, V.I. Kulakov NMRC for OG&P, Ministry of Health of Russia, +7(985)999-60-00, g_chernukha@oparina4.ru, 117997, Russia, Moscow, Ac. Oparina str., 4.Ekaterina D. Miroshina, Ph.D. Student at the Department of Gynecologic Endocrinology, V.I. Kulakov NMRC for OG&P, Ministry of Health of Russia, +7(917)533-48-00, emiroshina.md@gmail.com, 117997, Russia, Moscow Ac. Oparina str., 4.
Sergei Yu. Kuznetsov, Ph.D., Radiologist, Obstetrician-Gynecologist at the Department of Gynecologic Endocrinology, V.I. Kulakov NMRC for OG&P, Ministry of Health of Russia, 117997, Russia, Moscow Ac. Oparina str., 4.
Ilya A. Ivanov, Ph.D., Obstetrician-Gynecologist at the Department of Gynecologic Endocrinology, V.I. Kulakov NMRC for OG&P, Ministry of Health of Russia,
+7(962)980-00-18, doctor.i.ivanov@yandex.ru, 117997, Russia, Moscow Ac. Oparina str., 4.
Authors' contributions: Miroshina E.D., Chernukha G.E. – concept and design of the study; Miroshina E.D., Chernukha G.E., Kuznetsov S.Yu. – data collection and analysis; Miroshina E.D., Ivanov I.A. – statistical analysis; Miroshina E.D., Chernukha G.E. – manuscript preparation; Chernukha G.E., Ivanov I.A., Kuznetsov S.Yu. – manuscript editing.
Conflicts of interest: The authors have no conflicts of interest to declare.
Funding: There was no funding for this study.
Patient Consent for Publication: All patients provided informed consent for the publication of their data.
Authors' Data Sharing Statement: The data supporting the findings of this study are available on request from the corresponding author after approval from the principal investigator.
For citation: Chernukha G.E., Miroshina E.D., Kuznetsov S.Yu., Ivanov I.A. Body mass index, body composition, and metabolic profile of patients with polycystic ovary syndrome.
Akusherstvo i Ginekologiya/Obstetrics and Gynecology. 2021; 10: 103-111 (in Russian)
https://dx.doi.org/10.18565/aig.2021.10.103-111
Similar Articles