Modern standards of MRI protocol and image analysis algorithm for ovarian lesions
Solopova A.E.
Ovarian lesion (OL) is the large and extremely heterogeneous group, and only 2% among them are malignant or borderline tumors [1-3]. Ovarian cancer (OC) is the seventh most common cancer among women worldwide and the third most common gynecological cancer after endometrial and cervical uterine cancer, with a frequency of 10-15 cases per 100,000 women worldwide [1]. At the same time, OC is leading in the pattern of mortality from gynecological oncological diseases. More than 240,000 women are diagnosed with OC annually [2], and the survival rate is less than five years in 45% of patients [2].
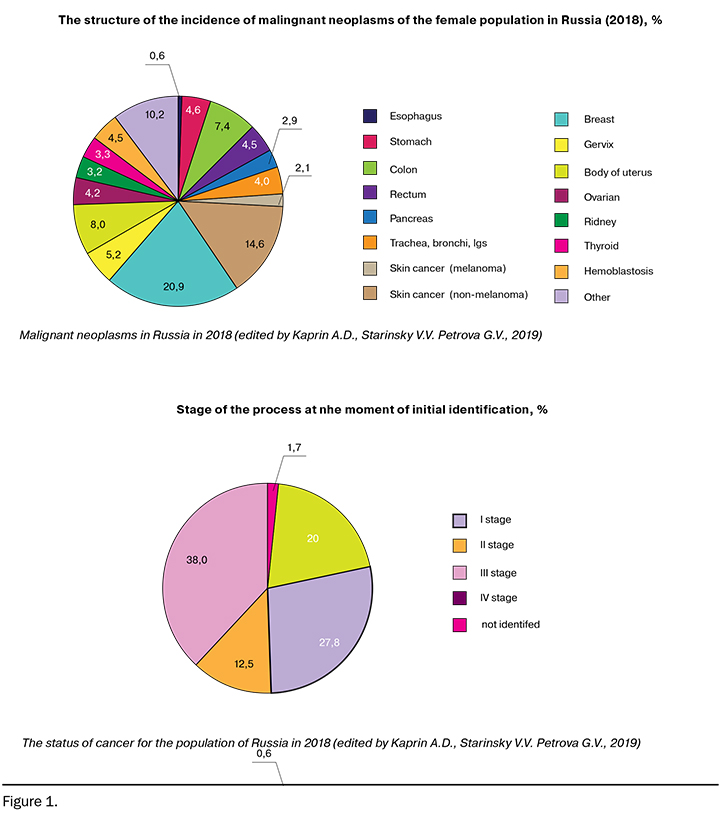
Among the female population in Russia (2018), OC accounts for 4.2% of cases, namely 76.2 cases per 100,000 women. Moreover, the mortality rate in the first year since the initial diagnosis was 26.2% in 2008 and 21.3% in 2018, the reason was the late reversibility at advanced stages (38% at stage III of the disease) (Fig. 1) [4, 5].
In recent decades, much effort has been invested in improving the quality of preoperative diagnosis of OL by developing models for stratifying the malignancy risks, systems for evaluating the data obtained using various research methods, and their combinations, since the management tactics have fundamental differences [6].
In clinical practice, a significant proportion of OL (up to 25% according to various sources) cannot be fully characterized after ultrasound examination [7]. Thus, even with the implementation of the International Ovarian Tumor Analysis (IOTA) group criteria up to 22% of OL remain undetermined in terms of malignancy during ultrasound examination [6]. Most of them turn out to be benign / tumor-like: hemorrhagic and endometrial cysts, cystadenomas, mature teratomas, uterine leiomyomas, ovarian fibroids [8].
Nowadays, magnetic resonance imaging (MRI) is the gold standard in the clarifying differential diagnosis of OL [9]. MRI allows for the accurate characterization of OL and differentiation between benign and malignant lesions with highest specificity. The diagnostic accuracy of differential diagnosis of OL using MRI ranges from 83% to 98%, depending on the research protocol and the algorithm for analyzing the data [10].
Indications for MRI (ESUR, 2017, [7])
- The lesion with the complex structure with an indefinite degree of malignancy according to ultrasound.
A large lesion in the pelvic cavity without clear organ affiliation. - A lesion adjacent to the uterus, with controversial organ affiliation.
- Solid OL with heterogeneous structure with polymorphic blood flow by ultrasound.
Examination Preparation Guidelines
- 1–2 days before the examination - light diet excluding the products that enhance intestinal motility and meteorism.
- 2-3 hours of fasting before the examination.
- Taking antispasmodic drugs (orally) 15 minutes before the examination or immediately before the examination (intramuscularly) .
- Moderate filling of the bladder.
MR imaging protocol of pelvis for OL
For the initial assessment of the pelvis organs anatomy, T2-weighted imaging (T2WI) should be performed:
- in the sagittal plane between the femoral heads;
- in the axial plane from the hilum of kidneys to the pubic symphysis;
- in the coronal plane (and / or using the suppressing signal from fat (FS) in the third plane);
- to assess the presence of blood / fat component of the tumor - T1- weighted imaging (T1WI), as well as using the suppression from fat (FS) in the third plane.
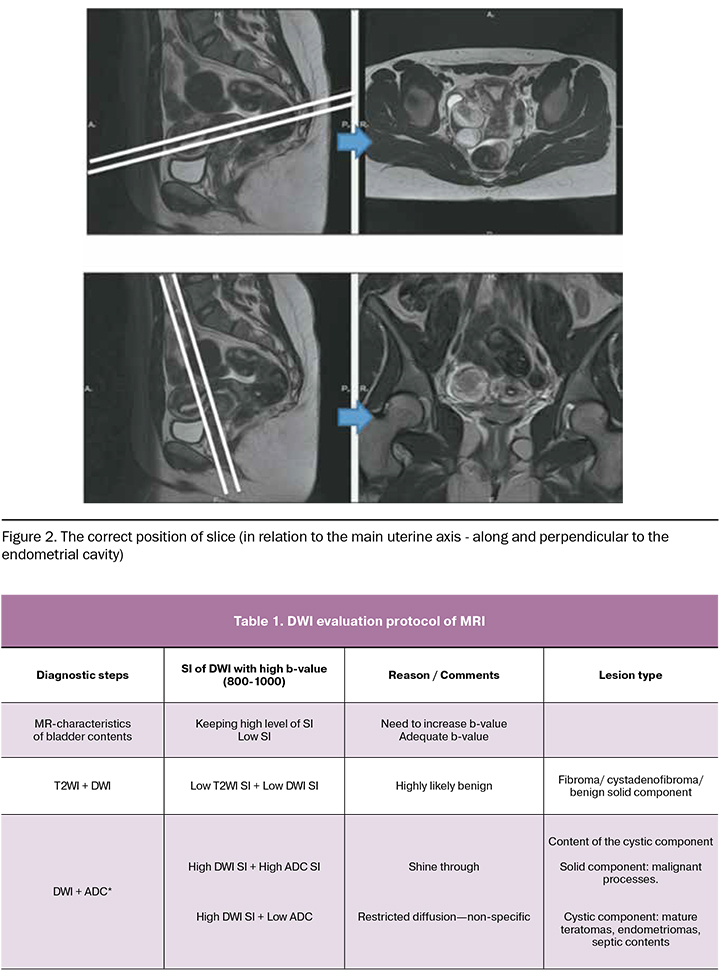
Pelvic MRI should be performed with the correct positioning of the slices (in relation to the main uterine axis - along and perpendicular to the endometrial cavity, Fig. 2).
Diffusion-weighted imaging (DWI)
Nowadays DWI plays an important role in complex MR imaging of OL [11-14]. In order to obtain accurate results, it is necessary to achieve the optimal b-value, which is crucial to suppress the high basic signal intensity (SI) from the free diffusion of water molecules, while maintaining a sufficient signal-to-noise ratio.
During pelvic MRI, it is advisable to use the bladder contents to control the b-value, since it has a high SI at b = 0 and decreases with increasing b-value. When SI from the bladder is completely suppressed, the optimal value of the b-value for analysis is achieved. The optimal value of the b-value is usually 800–1000 s/mm2, but sometimes it can be increased to 1200 or 1400 s/mm2. [15].
It is worth noting that DWI is not recommended for the diagnosis of mature ovarian teratomas and endometriomas (Table 1). In practice, the vast majority of them have reliable differential diagnostic features on the base of T2W in combination with T1W and FS T1W (see the section “Diagnostic algorithm for assessing MR images in the differential diagnosis of OL”) [7].
At the same time, DWI has high diagnostic value in evaluating OL without dermoid / hemorrhagic cysts, which present as isolated solid, as well as cystic-solid masses: diagnostic accuracy increases by about 15% when DWI is added to the basic MRI protocol [13]. If the solid component of OL has a low SI at T2W and the low MR-signal at DWI with high values, there is a high likelihood of lesion benignity and this is irrespective of the contrast agent accumulation characteristics. It plays an important role when differential diagnosis is necessary during pregnancy or if there are other contraindications for contrast administration [12].
On the other hand, when revealing a predominantly solid masses / solid component with a active diffusion restriction in the structure, dynamic contrast – enhanced (DCE) protocol is recommended.
Dynamic contrast-enhanced MR imaging
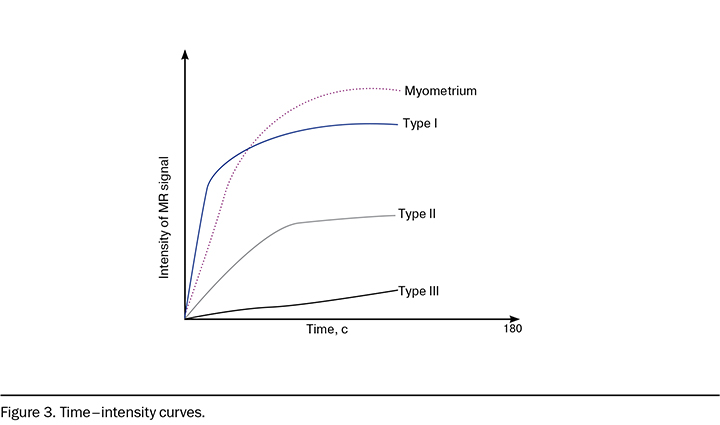
The analysis of dynamic contrast enhancement is based on the comparison of the «time–intensity curve» of the solid component in OL and the normal myometrium using the classification of C.K. Kuhl et al. (2003) [16]: curves are divided into three main types by the SI characteristics in different phases of dynamic contrast enhancement in relation to the accumulation curve in the myometrium, if the uterus is present (Figure 3).
Time–intensity curve Type I is a curve characterized by a constant growth with a low rate of contrast agent (CA) accumulation compared with myometrium; Type II is a curve characterized by a rapid increase in SI with the subsequent lesion of a plateau; Type III is a curve characterized by a pronounced, fast maximum (exceeding or close in intensity and amplitude of the rise of the MR signal to the myometrium), which can then be variable: characterized by a rapid decrease in the amplitude of SI in the first minutes / stabilization and plateau lesion [16]. Thus, DCE sequences must be acquired in a plane that involves the solid component and the myometrium, either the plane is selected by the radiologist (2D T1W sequences) or a 3D T1W followed by post-processing reformation [7].
If the solid component is characterized by rapid, active accumulation of CA (curve type III), tumors have a high probability of malignancy, while tumors with a low amplitude and intensity of its accumulation relative to the myometrium (curve type I) have a low risk of malignancy [17-20].
For more detailed assessment with the possibility of sufficient time resolution (205 s) acquisition, it is possible to conduct:
semi-quantitative assessment (SI half-rise period, maximum curve slope, CA accumulation amplitude);
quantitative assessment of perfusion of the solid component (Ktrans; Kep; ve), moreover, to date the isolated use of these types of assessment does not have sufficient reproducibility on various devices and programs of post-processing evaluation and refers to promising areas for further development..
Diagnostic algorithm for assessing MR images in the differential diagnosis of OL
Based on the MR-characteristics, OLs are divided into three groups:
- Lesions with a high SI on T1-weighted images (T1WI)
- Solid lesions on T2WI with SI, similar to skeletal muscles (lesions with low SI on T2WI), or with SI higher than muscle (lesions with an intermediate SI on T2WI), or solid structures with a heterogeneous SI
- Complex cystic-solid lesions.
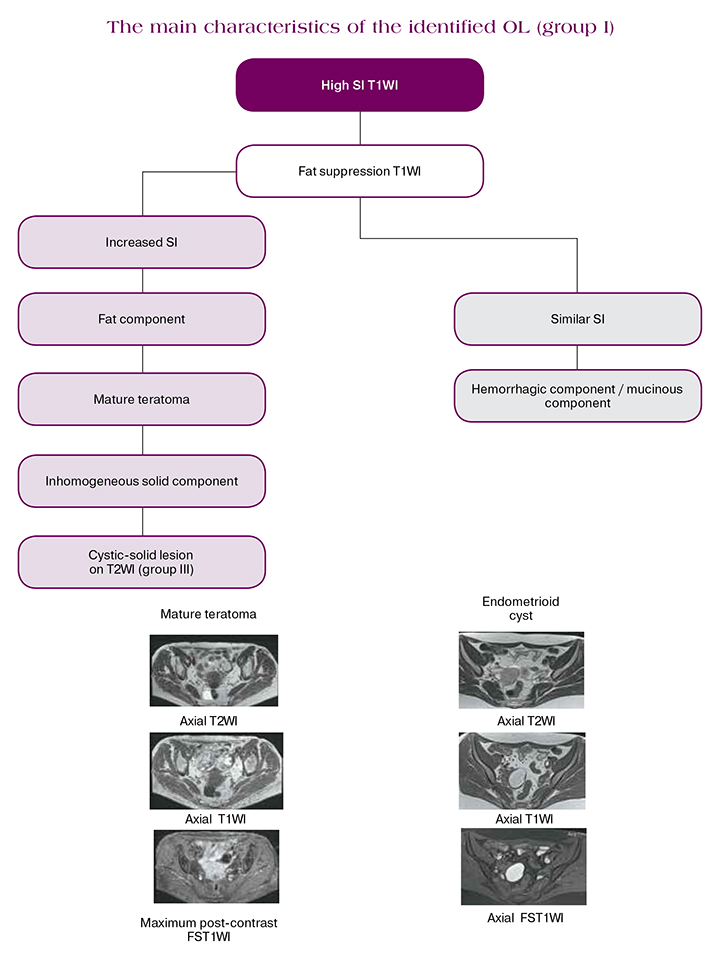
Lesions with a high SI on T1-weighted images
Lesions in this category require visualization at T1WI with suppression of the MR - signal from fat (FS) in order to differentiate the fat component from hemorrhagic. Therefore, the T1FS sequences should be performed in the same plane as the T1WI for ensuring the correct comparison of small components.
Hemorrhagic lesions may have a variable SI on T2WI, while their differ by the high SI on T1WI (no decrease on T1FS), due to extracellular methemoglobin [7].
Detection of a solid component in the lesions with high SI T1 requires an additional assessment in order to differentiate the solid component from thrombus (the algorithm is similar for lesions of group III) [20].
Mature cystic teratomas are benign, nevertheless they can have malignancy loci, it is also necessary to exclude the presence of heterogeneous solid components with intermediate SI for differential diagnosis with dysgerminomas.
Caution is required when using DWI and DCE to evaluate lesions with high SI on T1WI.
Both sequences may give false positive results in benign cystic teratomas: since the epidermal components of the teratoma restrict free diffusion, the intensity of the MR - signal is similar to the malignant lesions, and the solid components of benign teratomas may have type II/III curves of contrast agent accumulation [21].
SI of hemorrhagic lesion cystic component (endometriomas, hemorrhagic cysts) on DWI may vary within a wide range and have no additional diagnostic value.
Thus, the content of the fat component or blood in lesions with high SI on T1 may be easily and efficiently determined using a combination of images T1WI, T2WI and FST1WI. However, if lesions have solid components or teratoma has a heterogeneous solid component, further evaluation with intravenous administration of gadolinium-containing contrast agentA is recommended.
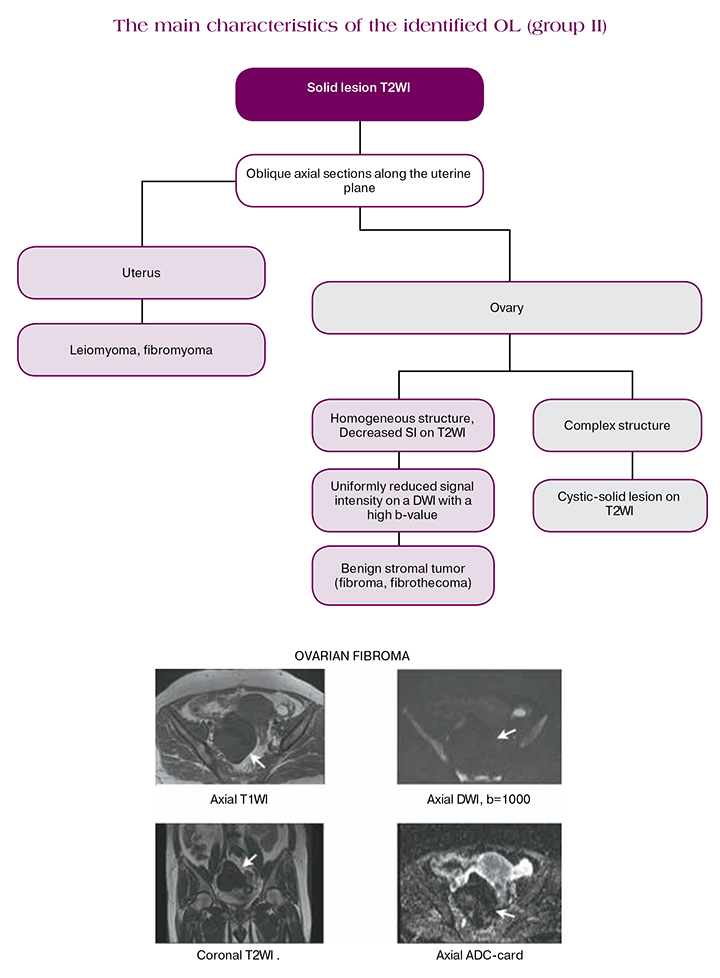
Isolated solid lesions
Isolated solid OL always causes concern in non-invasive diagnosis due to the risk of secondary damage. In practice, the overwhelming majority of them are benign fibro-muscular lesions, such as stromal tumors, for example, ovarian fibroma or uterine leiomyoma [8].
For accurate differentiation at the initial evaluation, it is necessary to determine their anatomical location: in the ovaries or in the uterus. So, stromal tumors of the ovary are surrounded by compressed ovarian tissue (“beak symptom”), differentiate from the uterus; in postmenopausal patients, only the contralateral unchanged ovary is often clearly defined. With uterine leiomyoma, a solid lesion is surrounded by compressed myometrial tissue. Uterine leiomyoma can also have subserous localization on the basis containing the supplying vessels. Visualization of the basis and blood vessels becomes possible when using the inclined axial plane T2WI through the maximum point of contact between OL and the uterus [7].
On DCE MRI, ovarian fibroma / tecoma usually shows a curve type I. DCE MRI is also relevant for the differentiation of subserous uterine leiomyoma from ovarian fibroma due to a more detailed visualization of the surrounding ovarian tissue [11].
Currently DWI is definitely recommended for inclusion in the protocol: solid lesion / component that has a low signal on the DWI sequences with high b-value may be considered as benign, and DCE is not required. Wherein, OL with an intermediate SI on T2W or with low SI on T2WI, having a heterogeneous / increased signal at the DWI, needs additional assessment with DCE MRI (considered as group III OL) [7].
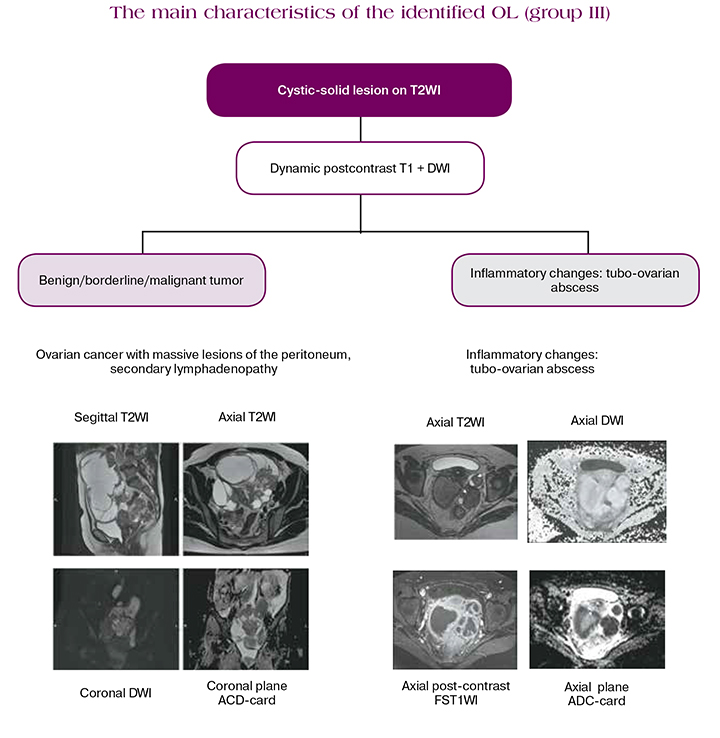
Complex cystic-solid lesions
In cases with a high probability of malignancy of solid, as well as predominantly cystic lesions with the presence of solid components / papillary projections, DCE MRI is necessary. Post-contrast imaging (typically 30 seconds after injection) is the most widely available [7]. Wherein in the current MRI protocol, DCE is recommended for use for a more detailed assessment of the contrast agent accumulation kinetics.
When evaluating with DWI, the high intensity of MR signal in the study with b> 800 s / mm2 with a corresponding low signal on the ADC, indicating the presence of a true diffusion restriction, is characteristic of OC. Some benign tumors (benign cystic teratomas, endometrioid cysts, some tecomas, degenerative leiomyomas and Brenner tumors) may have a similar SI for DWI, as in malignant neoplasms. In addition, the quantitative assessment of ADC has pronounced limitations due to a significant overlap of values.
At the same time, a low DWI signal when used with a high b-value is one of the most important criteria for the characteristic of OL as benign [12].
It is very important to remember that inflammatory ovarian diseases, namely tubo-ovarian abscesses, can simulate the visual structure of tumors, while the clinical picture can be erased, especially when using antibiotic therapy. They have a complex structure, an active peritoneal reaction on native sequences and while contrasting, which simulates peritoneal implantation lesions. In this case, SI of the cystic component will be the most significant differential diagnostic criterion from septic contents on DWI (b> 800): heterogeneous increase DWI and reduced SI on ADC.
The criteria for evaluating OL, which must be recorded in the study protocol:
- dimensions of OL (three linear, volume);
- unilateral / bilateral localization;
- characteristics of the lesion structure:
- characteristics of the cystic component (fluid / blood / fat content);
- presence of a solid component / vegetation / irregular thickening of the walls or internal partitions of the lesion;
- signal intensity of a solid component in T2-weighted images;
- signal intensity of a solid component in diffusion-weighted images with a high b-factor, ADC value;
- type of contrast agent accumulation curve in a solid component;
- presence of necrotic zones / hemorrhage in the solid component.
- presence of MR-signs of invasive growth of the lesion (spread to adjacent organs, parietal and visceral carcinomatosis in the study area, ascites, metastatic lymph nodes).
References
- International WCRF. Ovarian Cancer Statistics 2012 2017 (updated 04-01-2017; cited 2017 04-01-2017). http://www.wcrf.org/int/cancer-facts-figures/data-specific-cancers/ovarian-cancerstatistics.
- Webb P.M., Jordan S.J. Epidemiology of epithelial ovarian cancer. Best Practice and Research Clinical Obstetrics and Gynaecology Journal. 2017; 41: 3-14.
- Brun J.L., Fritel X., Aubard Y., Borghese B., Bourdel N. Management of presumed benign ovarian tumors: updated French guidelines. The European Journal of Obstetrics & Gynecology and Reproductive Biology. 2014; 183: 52-8.
- Kaprin A.D., Starinskiy V.V., Petrova G.V. Zlokachestvennyye novoobrazovaniya v Rossii v 2018 godu (zabolevayemost' i smertnost'). M., 2019. (in Russ.)
- Kaprin A.D., Starinskiy V.V., Petrova G.V. Sostoyaniya onkologicheskoy pomoshchi naseleniyu Rossii v 2018 godu. M., 2019.(in Russ.).
- Kaijser J., Sayasneh A., Van Hoorde K., et al. Presurgical diagnosis of adnexal tumours using mathematical models and scoring systems: a systematic review and metaanalysis. Human Reproduction Update. 2014; 20: 449-462
- Forstner R., Thomassin-Naggara I., Cunha Т.М., Kinkel К., Masselli G. Kubik-Huch R., Spencer J. A., Rockall А. ESUR recommendations for MR imaging of the sonographically indeterminate adnexal mass: an update. European Radiology. 2017; 27(6): 2248-2257.
- Ameye L., Timmerman D., Valentin L., Paladini D., et al. Clinically oriented three-step strategy for assessment of adnexal pathology. Ultrasound in Obstetrics and Gynecology. 2012; 40: 582-591.
- Anthoulakis C., Nikoloudis N. Pelvic MRI as the „gold standard” in the subsequent evaluation of ultrasound-indeterminate adnexal lesions: a systematic review. Gynecologic Oncology. 2014; 132: 661-8.
- Lalwani N., Prasad S.R., Vikram R., Shanbhogue A.K., Huettner P.C., Fasih N. Histologic, molecular, and cytogenetic features of ovarian cancers: implications for diagnosis and treatment. Radiographics. 2011; 31 (3): 625-46.
- Mandai M., Yamaguchi K., Matsumura N., Baba T., Konishi I. Ovarian cancer in endometriosis: molecular biology, pathology, and clinical management. The International Journal of Clinical Oncology. 2009; 14: 383-391.
- Poncelet E., Delpierre C., Kerdraon O., Lucot J.P., Collinet P., Bazot M. Value of dynamic contrast-enhanced MRI for tissue characterization of ovarian teratomas: correlation with histopathology. Clinical Radiology. 2013; 68: 909-916.
- Chung B.M., Park S.B., Lee J.B., Park H.J., et al. Magnetic resonance imaging features of ovarian fibroma, fibrothecoma, and thecoma. Abdominal imaging. 2015; 40: 1263-1272.
- Thomassin-Naggara I., Daraï E., Cuenod C.A., Fournier L., Toussaint I., Marsault C., et al. Contribution of diffusion-weighted MR imaging for predicting benignity of complex adnexal masses. European Radiology. 2009; 19: 1544-1552.
- Thomassin-Naggara I., Toussaint I., Perrot N., et al. Characterization of complex adnexal masses: value of adding perfusion- and diffusion-weighted MR imaging to conventional MR imaging. Radiology. 2011; 258: 793-803.
- Kierans A.S., Bennett G.L., Mussi T.C., et al. Characterization of malignancy in adnexal lesions using ADC entropy: comparison with mean ADC and qualitative DWI assessment. Journal of Magnetic Resonance Imaging. 2013; 37: 164–171.
- Namimoto T., Awai K., Nakaura T., Yanaga Y., Hirai T., Yamashita Y. Role of diffusion-weighted imaging in the diagnosis of gynecological diseases. European Radiology. 2009; 19: 745-760.
- Thomassin-Naggara I., Toussaint I., Perrot N., et al. Characterization of complex adnexal masses: value of adding perfusion- and diffusion-weighted MR imaging to conventional MR imaging. Radiology. 2011; 258: 793-803.
- Thomassin-Naggara I., Balvay D., Aubert E., et al. Quantitative dynamic contrast-enhanced MR imaging analysis of complex adnexal masses: a preliminary study. European Radiology. 2012; 22: 738–745.
- Bernardin L., Dilks P., Liyanage S., Miquel M.E., Sahdev A., Rockall A. Effectiveness of semi-quantitative multiphase dynamic contrast-enhanced MRI as a predictor of malignancy in complex adnexal masses: radiological and pathological correlation. European Radiology. 2012; 22: 880-890.
- Thomassin-Naggara I., Aubert E., Rockall A., et al. Adnexal masses: development and preliminary validation of an MR imaging scoring system. Radiology. 2013; 267: 432-443.
- Mandai M., Yamaguchi K., Matsumura N., Baba T., Konishi I. Ovarian cancer in endometriosis: molecular biology, pathology, and clinical management. The International Journal of Clinical Oncology. 2009; 14: 383-391.