The visual transformation of healthcare information systems: a global digital exemplar from a UK university hospital for women’s health
Rew D.
Objective. This essay describes the development of a wholly new form of timeline structured iconographic interface for the electronic patient record (EPR). This provides a fast and highly efficient means through which to view complex medical records from multiple data sources, with global health applications.
Methods. Using a simple concept as the design framework, we have worked from first principles of agile and iterative software development to upcycle large quantities of electronic clinical data into a visually intuitive and efficient EPR format, with a wide range of practical clinical applications. The system was built within the existing Clinical Data Estate (CDE) and IT systems of a UK NHS University Hospital, by a small volunteer team at negligible cost.
Results. Over ten years, we have developed the system from initial concept to a live EPR interface at the centre of our CDE for some 5,000 authorised users, to display some 2.5 million individual patient e-records in real time. We have also built a derivative exemplar data system for the “whole of life” study of chronic diseases of childhood and adulthood, using a dynamic data set of 18,000 locally treated breast cancer cases within our Women’s Health service.
Conclusions. Agile software development puts the true user of information at the centre of digital design. When combined with the key principles of e-data visualisation, it can produce transformative clinical systems. The early sharing of insights and solutions will help accelerate beneficial change in our understanding of individual and population health.
Keywords
electronic patient record
data visualisation
timelines
Iconography
The transition from paper based to digital healthcare information systems is as significant an evolution in communications for mankind as the move from cave painting to papyrus, or Gutenberg’s invention of the printing press.
The next transformation in technology, from paper to digital systems, permits the near instantaneous transmission and manipulation of healthcare information from many different data stores and geographically discrete sources to the point of need and use. It also allows the manipulation, repackaging and re-presentation of information in ways which are not possible with paper records.
The leading technologies are in a state of rapid evolution, which poses a major challenge for healthcare administrators and purchasing professionals as to where to invest resources in system acquisition and development.
Moreover, the design of software systems for healthcare professionals has lagged behind personal device design. In consequence:
- healthcare users are forced to spend a lot of time in navigating and searching for documents in multiple software systems to discover the full clinical story;
- clinical risk is increased, as key documents and information are overlooked in time-constrained services
- user fatigue and dissatisfaction is greatly increased;
- Large IT investments are not used to best advantage by healthcare providers.
«Digital by Default» Principles
Since 2010, the UK Government Digital Service (GDS) has promoted the importance of User Centred Discovery and Design in all public sector services though a rolling series of blog posts, service manuals and practical initiatives in all major departments of state in national and local government [1, 2].
It aims to create a wholly “Digital by Default” public sector IT infrastructure. This means that IT design will always be so good that it will always be preferred to historic ways of working.
These principles are now beginning to influence IT systems design in the UK National Health Service. For too long, the end user experience of healthcare data systems has been unsatisfactory, in consequence of limited end user research and design. “Digital by Diktat” systems are built by IT programmers without detailed attention to the true user needs.
The UK GDS approach emphasises the importance of the software systems lifecycle through:
- Discovery – of the real needs and working practices of the target group;
- to software modelling during the Alpha phase;
- though Beta testing on a selected user group and then on larger groups;
- to Live Release;
- and finally to Retirement and Replacement.
It recognises that unlike print publishing, the development process of excellent software is never complete, because the technology, the user needs and the technical solutions change continuously.
Agile and Iterative software development principles provide great flexibility in software development, through which ideas evolve into working systems in stepwise changes which are continuously and rigorously tested against the user needs, and which can be easily discarded if they do not work as intended. This provides for a rapid change in the direction of development at minimal cost if a system is not working as planned. In “Showing the Thing” to the user at regular intervals, we acknowledge that the human brain is a very powerful testbed in the development of visually rich IT systems.
Methods
The Digital Architecture at University Hospital Southampton (UHS)
Like all modern healthcare organisations, UHS has a wide variety of legacy software and hardware IT systems to address the needs of some 2.5M patient records and some 10,000 employees, including health care professionals, secretarial and administrative staff, and hospital managers. The systems are in a continuing state of evolution, and the complexity is illustrated in Figure 1.

The UHS IT system can be traced back to the early 1990s, when electronic pathology reporting systems were first introduced. In the mid 1990s, a number of far sighted and critical decisions were made which underpin our later work, in that:
- All electronic clinical documents were standardised, initially in Word 6 format and later (from 2003 onwards) in a html document format, eDocs.
- Metadata, recording the source, clinical discipline and date-time stamp was applied to each document
- The entire data environment was internet enabled with tcp/ip protocols
- An agile and iterative approach to system development placed the entire system under local control, rather than that of commercial vendors.
This evolutionary approach is sustainable, and it has given the hospital maximum flexibility and adaptability in design and implementation, at least cost, when national policy was towards the purchase of large commercial systems.
The UHS Lifelines Electronic Patient Record (EPR) Interface
By 2009, it was apparent that significant improvements to the EPR interface would be necessary if clinicians were to able to make the best use of the growing volume of digital information across the EPR, and to work with maximum efficiency and clinical safety.
My interest in data visualisation methods was first stimulated by the graphical work of the French Engineer Charles Minard, who depicted Napoleon’s disastrous March on Moscow of 1812-13 in multiple dimensions of data, mapped onto a simple chart, as recorded in Edward Tufte’s seminal book on Data Visualisation [3].
It was further stimulated by the published work in the 1990’s of Professor Ben Shneiderman and his team at the Human Computer Interaction Laboratory of the University of Maryland. In particular, I was struck by their concept model for an interactive EPR, Lifelines (Figure 2) [4-5], which stood out clearly from other forms of EPR visualisation [6,7].

To the best of our knowledge, The Lifelines model was so far ahead of its time that it was never implemented as a practical system. However, we realised that the simple two dimensional architecture of stacked timelines, and the interactive nature of the iconography, could be used as a framework for a live exemplar system in our own CDE.
The power of visualisation of complex data sets
Evolution has optimised the visual cortex and the “eye-brain” interface of the human nervous system to ultra-fast processing of imagery, which includes shape, complexity of pattern, size, colour, relative position, depth and movement.
In contrast, the frontal cortex processes information more slowly, in the form of reading text and data, and particularly in terms of assembling the patterns in the data.
A system which is optimised for the visual cortex is thus a particularly powerful format for the communication of complex information .
From late 2009 onwards, we experimented with the concept within our replica test system. We worked in a pragmatic, highly agile and iterative manner to produce a working version of the Lifelines concept within our Clinical Data Estate, and using the available clinical data from various systems. (Figure 3)
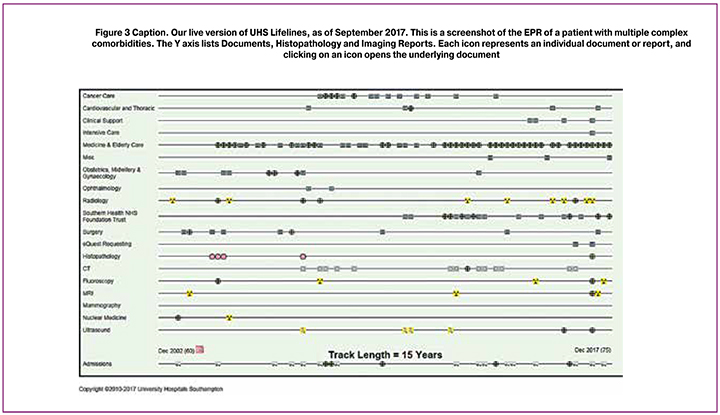
The first model of UHS Lifelines gave us confidence in the transformative potential of the project, in that it proved:
- that the whole EPR could be displayed on a single interactive screen
- that a dynamic system could be built, in which the timeline adapted continuously to the addition of new documents
- that the Y axis could be expanded incrementally to include timeline structured data from any other relevant and available source into the data framework.
- that the system could be optimised for fast display and interrogation of multi-factorial clinical information
- that the system radically reduced the time taken to understand the case history and to access key documents of any age, when compared with “standard formats” of multiple windows, tabs and lists of documents.
The system is also wholly compliant by intention with Professor Shneiderman’s mantra for the interactive visualisation of a complex data set [8, 9], in that it provides:
- an Overview of the entire data set
- The ability to Zoom In on any feature (or document) of interest
- The ability to Filter Out extraneous and unwanted content
- The ability to obtain Details on Demand.
The system has continued to evolve rapidly through a series of versions, as we have addressed a range of technical challenges in a continuously evolving clinical data estate.
Results
By late 2016, we had the collective confidence to integrate the interface in a “Live Beta” mode within the UHS EPR. By August 2017, we were confident to “go live” with a fully integrated platform.
UHS Lifelines continues to evolve as we expand the range of user cases for different clinical disciplines (for example Anaesthesia, General Medicine) and as we add more types of information to the timelines.
Controls to Confidentiality
We also recognise that the use of iconography permits individuals considerable control over privacy and confidentiality of sensitive elements of their medical records. Although the icons were first introduced as windows onto the underlying documents, it became apparent that the icons could also be used to close off sensitive information, while alerting the observer to the existence of the underlying document.
We are now looking (mid 2019) at ways to make the content directly available to patients through a secure APP; to embed it in other data systems, such as our National Cancer Data System; and to make it directly available to family practitioners in the region, therefore substantially improving the flow of critical and secure clinical information between the hospital and the wider user community.
We are also in discussion with national healthcare agencies as to how best to widen the uptake and use of the concept in a “universal” EPR interface.
Reading the clinical story in the iconography
We also came understand how it is possible to “read the medical record” in the patterns of icon display and the metadata to a high degree of fidelity, without having access to all of the underlying data.
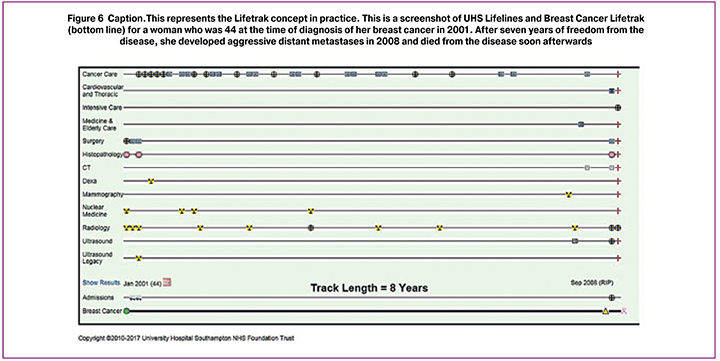
For example, Figure 3 quite clearly describes a woman (note the Obstetrics timeline) with a chronic medical problem or problems, a cancer story and multiple hospital admissions over many years. Figure 7 clearly describes a woman who remained remarkably well after her initial cancer treatment in 2001, until it returned aggressively in 2008.
The pre-selection of Healthcare Documents and Data for digital display
The core purpose of an effective clinical information interface is to permit the health professional to make the most appropriate and accurate clinical decision in the least available time and with the least fatigue. To this end, the design principle of End User Optimisation (the Digital by Default strategy) has produced a fast, intuitive and comprehensive overview of the clinical data set which is enjoyable to use.
However, traditional paper clinical records contain large volumes of content which have little or no clinical or administrative value in the days, weeks or months after they have been generated. Indeed, in some cases, 90-95% of clinical record data adds no long term value to the long term management of the patient.
This introduces a further principle of clinical record visualisation, which is Radical Simplification. Thus, for example, a single well written discharge summary will consolidate the information in dozens or hundreds of pages in documents from a complex hospital admission.
In many national jurisdictions, there is a requirement to keep all documentation for a fixed period of years after it has been generated, in order to permit case review, clinical research and medico-legal evaluation.
However, we have observed that if all documentation were to be displayed on an interface such as Lifelines, or in list mode in document repositories, then the time needed to read and review the content would make normal clinical work impossible.
Controls to Digitisation of the Entire Clinical Record
From 2014 onwards, UHS has been involved in a challenging process of full digitisation of all active clinical records, which in some cases has involved the electronic capture of hundreds or thousands of pages of paper pages in PDF format.
Our chosen electronic storage solution was to adopt and adapt the Onbase high capacity electronic document management (EDM) system from Hyland Inc. (Cleveland, Ohio), along with high speed scanners to capture historic records. However, in recognition of the challenge of document overload, we applied metadata to each class of document to be scanned, which identifies them for long term clinical purposes as:
Critical Documents: These would include clinic notes, letters, operation notes, anaesthetic charts, discharge summaries and multidisciplinary team records.
Transient Documents: These would include fluid charts and much other “short life” paperwork that is generated during the course of a hospital admission;
Administrative Documents: These would include appointment letters and other routine and repetitive non-clinical documentation, which are often found in paper records
Safeguarding Documents: These documents require a higher level of privacy, for a variety of legal or operational reasons.
The Southampton Breast Cancer Data System
The development of UHS Lifelines allowed us to adopt a radical approach to build an exemplar timeline structured data system to activate the card index records of more than 12,000 breast cancer patients, all of whom had been treated at UHS and its partner hospitals since the 1970s.
Our solution was to build a framework record, which automatically creates a new record and populates it with core data for every patient whose hospital number is entered into the system. Thereafter, additional information is entered into the data fields manually, while we move to full automation of the system.
The system now contains almost 18000 records from the 1970s onwards, and it is largely complete for all records since 1990. Each record includes the pathology variables of the cancer at each stage in its evolution, and the key treatments used at each stage.
By building a version of Lifelines into every patient record, the need to recall and search through historic paper files is eliminated, and records can be updated very quickly. Our task was made much easier:
- through the reactivation of 500,000 inert legacy digital pathology records on old computer discs, dating back to January 1990.
- through the national system of recording deaths. This automatically updates the Patient Master Index in the hospital when a patient dies anywhere in the country. It thus allows us to bring closure to records of patients who have moved out of the area or who have not used the local health system in the recent past.
- through a series of legacy electronic data sets, which we were able to integrate into our new system, including data from the National Breast Screening Programme.
The breast cancer data system has multiple practical uses in the hospital. It is used in outpatient clinics and in multidisciplinary team meetings to review the individual case history. It is also a primary resource for clinical cancer research.
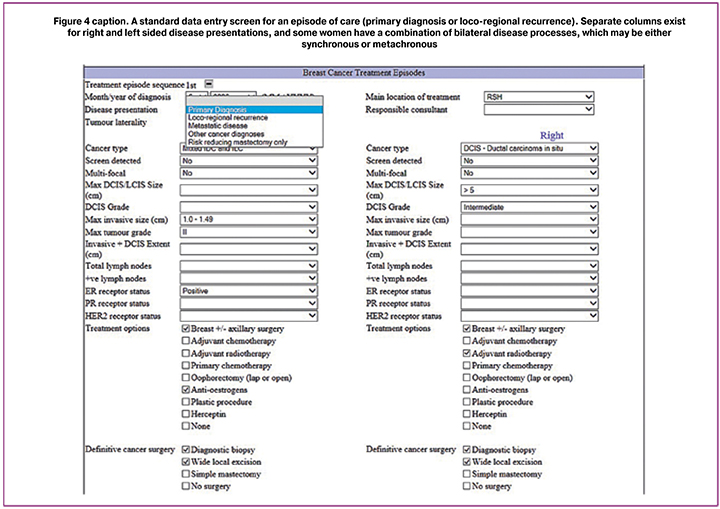
The Episode based data structure
Many chronic diseases of childhood and adulthood go through a series of transition stages in their evolution. In the case of breast and other cancers, the transition sequence is:
Primary Diagnosis/Presentation -> Loco-regional Recurrence -> Overt Distant Metastasis -> Death, where it has occurred, and from whatever cause.
We therefore structured our data base around episodes of care, aligned on a master timeline, the UHS LifeTrak. There is an episode based screen for direct data entry for each stage of the disease, as represented in Figure 4.
The Southampton «LifeTrak»
Data on pathology and treatment for each episode (or stage in the disease progression) is collected on a new set of data fields, and each episode is plotted on a timeline, the Cancer “Lifetrak”, which allows direct visualisation of the entire course of the disease.
We recognised that the course of a chronic disease was analogous to a railway line, where stations on the line represented these episodes (Figure 5). The distance between each station could be measured as a time or survival interval, which could then be related to the pathology variables and the treatment inputs for each stage on the journey.
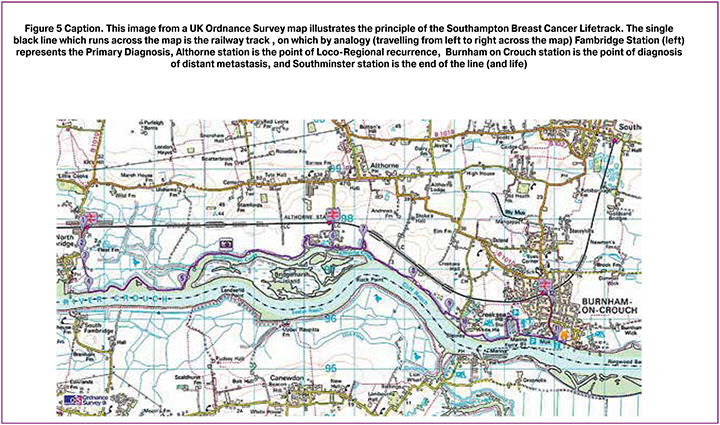
To extend the analogy, a human life is lived in a complex landscape of events. On our map, all of the roads and communities are other timelines and conditions which run in parallel to the railway track, while the River (Crouch) represents the river of life which flows through the case history (Figure 6).
We are also able to identify the true cause of death for most of our patients from data in UHS Lifelines, whether the cause is from breast cancer or from any other disease process or combination of diseases and age progression.
Data mining the Southampton Breast Cancer Data System
The automatic creation of a Lifetrack for every patient in the database provides a powerful tool for further analysis, in which the episodes of disease progression are transformed into measurable linear intervals.
This prompted us to create a data mining tool for the database, through which we could select and define cohorts of patients by a wide range of demographic, pathology, treatment and outcome variables, including those patients who subsequently developed recurrence or metastases, from any period of time over the past 40 years (Figure 7)
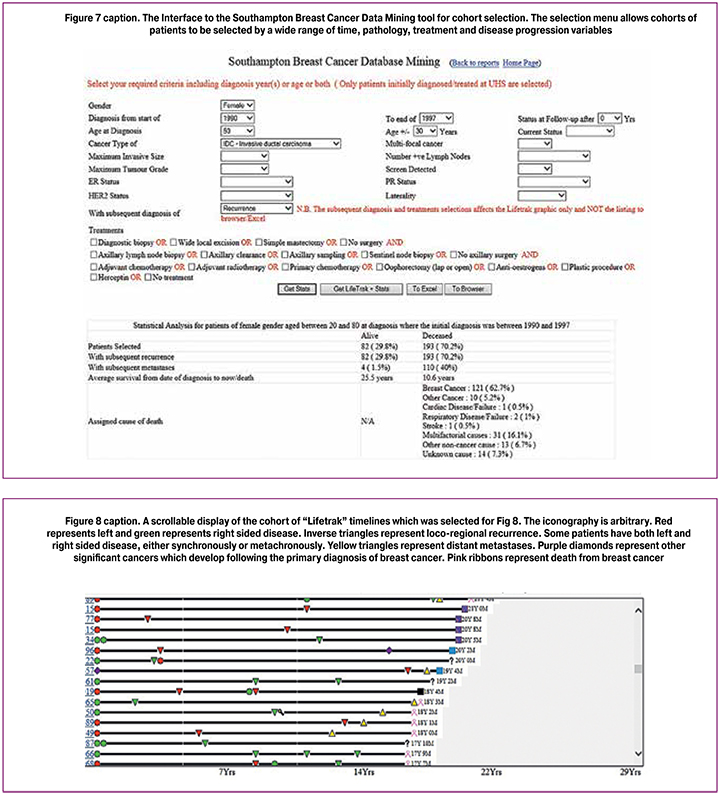
This provides two outputs, including key statistics on outcomes; and a display of all of the “lifetraks” for patients in the cohort, with links back to the primary records.
The «Get Stats»” function produces lists of patients who are still alive and those who have died, along with the known cause of death.
In this example, a cohort of patients is selected from 1990-1997 in the age range of 50 ±30 years who presented with invasive ductal carcinoma, and who subsequently had disease recurrence.
The «Get LifeTrak + Stats» selector also displays all of the individual patient Lifetraks in a scrollable format.
In due course, this function will allow us to perform studies of the episode-to-episode survival duration, which will then allow us better to understand the influences of pathology variables and of treatment inputs at each stage in the disease progression.
Discussion
The work described in this paper is a snapshot of a rolling programme of information technology developments at our hospital, which has been designated a “Global Digital Exemplar” Centre of Excellence for the UK National Health Service Digital Transformation Programme.
Our experience offers valuable insights for the evolution of a modern and cost effective digital health resource in a technically proficient health system. These insights can be considered in conjunction with the open source web publications of the UK Government Digital Service, which provide much valuable advice on the development of digital-centric public services, including healthcare services.
We highlight the determinants of successful healthcare software development:
- The importance of End User Optimisation, by which we mean the robust discovery and evaluation of the true end user needs of the system in daily operation.
- The importance of Radical Simplification, by which we mean the delivery to the user at the point of use all of the critical information that he or she needs to “read the story” in the clinical data and to come to a safe and efficient action decision, but without any clutter or extraneous information.
- The importance of adherence to Professor Ben Shneiderman’s four component mantra of “Overview, Zoom In, Filter Out and Details on Demands” to the design specifications of an interactive data visualisation system
- The importance of a strong working relationship, flexible thinking, respect and mutual understanding between the end user and the software development team, and of continuous communication, testing and feedback during the evolution of the software system.
- The value of agile and iterative development to a broad strategic conceptual direction, rather than detailed design specifications at the outset. This includes the value of the early development of visual and testable models (“Showing the Thing”) of the system which drive improvements and further developments.
Conclusions
Unlike a great work of art or a book, a software system is never complete, and continuous evolution must be built into the DNA of the system. Technology and user needs change continuously, and healthcare is one of the most complex, challenging and diverse systems into which to introduce wholly new systems of information management.
We believe that in UHS Lifelines, we have taken a significant step towards a more efficient, effective and safe system for clinical data evaluation, clinical decision assistance and accelerated research using clinical data.
In the derivative Breast Cancer Data System, we believe that we have created a new template for the digital representation and study of many longitudinal conditions and diseases of childhood and adulthood.
The challenge now is to bring an understanding of the potential benefits of such systems to a much wider professional audience worldwide, and to stimulate the competitive evolution of far wider applications of our practical research and development work to date.
References
- UK Government Digital Service Design Principles https://www.gov.uk/guidance/government-design-principles. Accessed 28th August 2018.
- Daily Blog Postings on Digital Development from the UK Gov.UK website https://www.blog.gov.uk/all-posts/
- Tufte E.R. The Visual Display of Quantitative Information.Graphics Press. Cheshire, Connecticut. 1983.
- Plaisant C., Shneiderman B., Mushlin R. An Information Architecture to Support the Visualization of Personal Histories. Information Processing & Management. 1997; 34 (5): 581-597.
- Plaisant C., Mushlin R., Snyder A., Li J., Heller D., Shneiderman B. LifeLines: Using Visualization to Enhance Navigation and Analysis of Patient Records Proc AMIA Symp. 1998; 76-80.
- Lesselroth B.J., Pieczkiewicz D.S. Data Visualisation strategies for the electronic health record. Nova Science Publishers Inc. 2011: 1-59.
- West V.L., Borland D.D.,Hammond W.E. Innovative information visualisation of electronic health record data: a systematic review. J Am Med Inform Assoc. 2015; 22: 330-339.
- Shneiderman B. The Eyes Have It: A Task by Data Type Taxonomy for Information Visualizations. Proceedings IEEE Symposium on Visual Languages. 1996; 336-343.
- Shneiderman B. A Grander Goal: A Thousand-Fold Increase In Human Capabilities Educom Review. 1997; 32: (6): 4-10.
Received 13.06.2019
Accepted 21.06.2019
About the Authors
David Rew , MA MChir (Cambridge) FRCS (London), Consultant General Surgeon, Breast and Endocrine Service Princess Anne Hospital for Women’s Health University Hospitals of Southampton, UK.Е-mail: dr1@soton.ac.uk Scopus Author ID: 7004393977For citation: Rew D. The visual transformation of healthcare information systems: a global digital exemplar from a uk university hospital for women’s health.
Akusherstvo i Ginekologiya/ Obstetrics and gynecology. 2019; 9:57-66.(In Russian)
https://dx.doi.org/10.18565/aig.2019.9.57-66